
SUMMARY
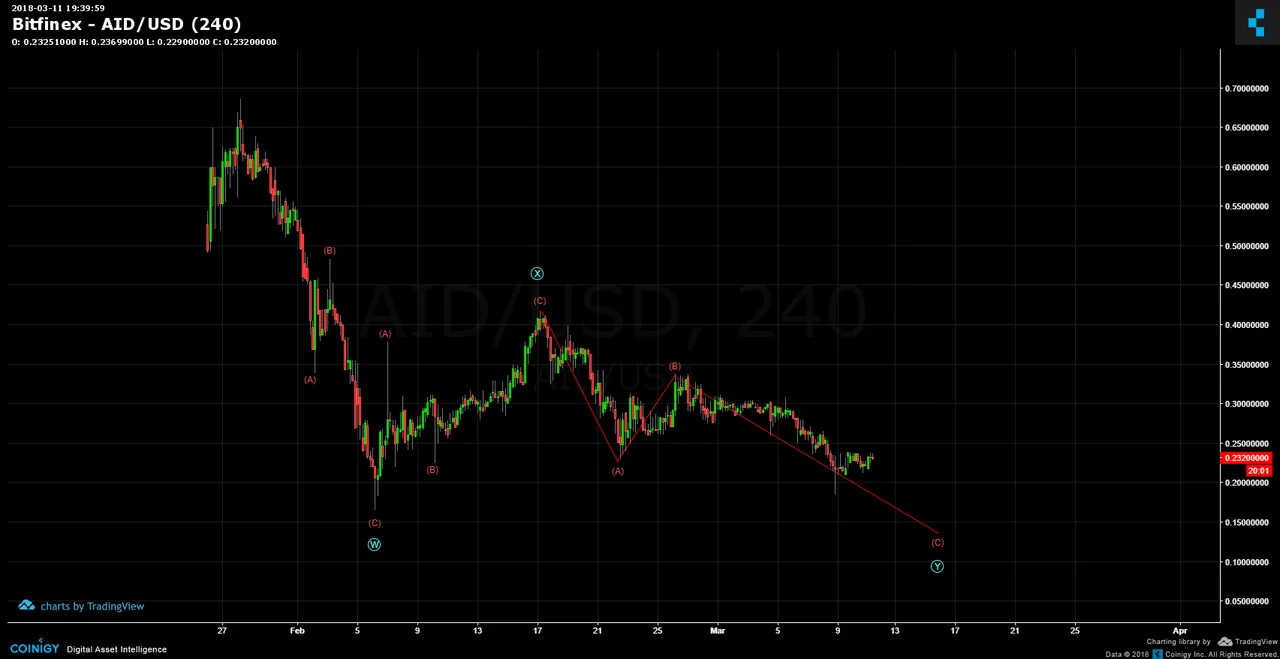
AidCoin (AID) price actions can be mapped as a WXY; otherwise known as a double three. The blue X connects two rounds of zigzag abc waves. It would be unsurprising to see this morph into a more sideways triple complex correction; however, there are not yet indications for this to occur. The final blue Y shows the abc subwave and the c is expected to reach below the level of blue W.
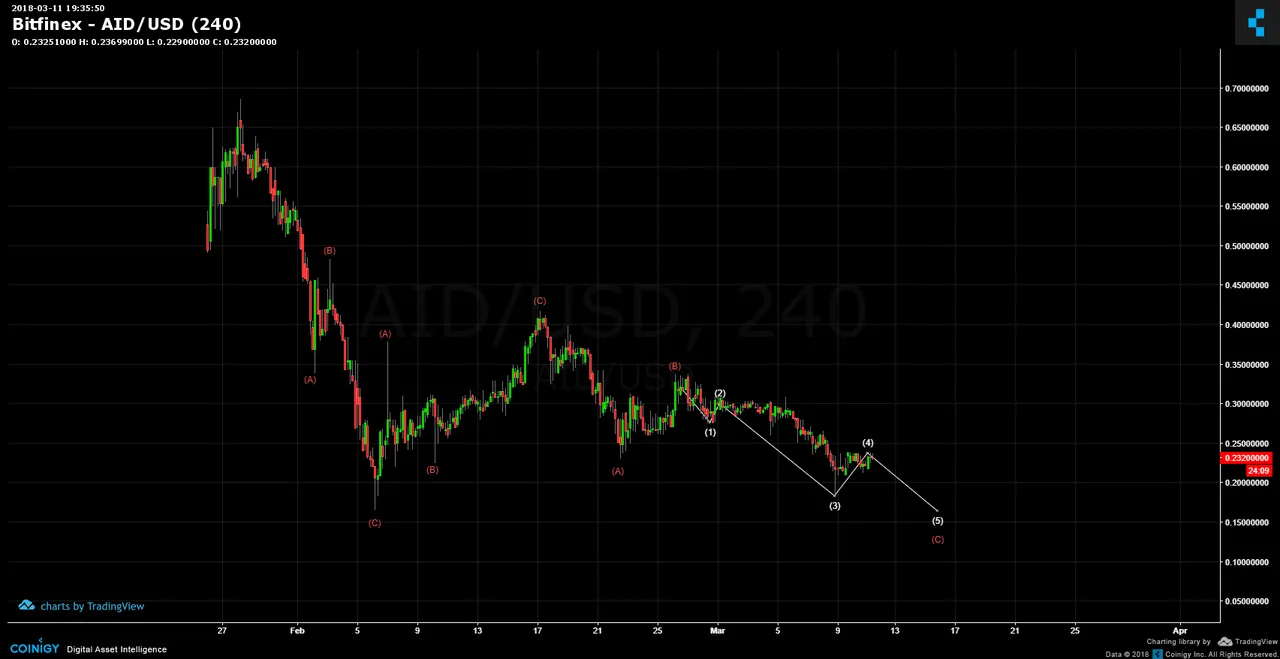
A closeup shows the final impulse components of rec C wave of blue Y. Since no other real rising impulse can be counted, the whole chart reflects a correction in motion. IF you currently hold this coin, please be aware that it is thinly traded and lacks liquidity and therefore can be subject to bouts of volatility.
Legal Disclaimer: I am not a financial advisor nor is any content in this article presented as financial advice. The information provided in this blog post and any other posts that I make and any accompanying material is for informational purposes only. It should not be considered financial or investment advice of any kind. One should consult with a financial or investment professional to determine what may be best for your individual needs. Plain English: This is only my opinion, make of it what you wish. What does this mean? It means it's not advice nor recommendation to either buy or sell anything! It's only meant for use as informative or entertainment purposes.
Please consider reviewing these Tutorials on:
Elliott Wave Counting Tutorial #1
Elliott Wave Counting Tutorial #2
Elliott Wave Counting Tutorial #3
Laddering and Buy/Sell Setups.
Laddering Example with EOS
Tutorial on the use of Fibonacci & Elliott Waves
@haejin's Trading Nuggets
Essay: Is Technical Analysis a Quantum Event?
Follow me on Twitter for Real Time Alerts!!
Follow me on StockTwits for UpDates!!
--
--

