Introduction
If you haven't read the other articles in this series, please check them out:
- Dashboard Dangers Part 1
- Dashboard Dangers Part 2
- Dashboard Dangers Part 3
- Dashboard Dangers Part 4
- Dashboard Dangers Part 5
Statistical Relevance
Many organizations and people make decisions based on the charts and graphs they see. However, they don't always ask the right questions before making a decision.
Suppose we are looking at data by gender. We want to see if we should market to men or women for a given product. Let's look at the data:
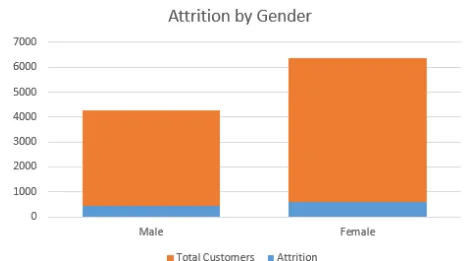
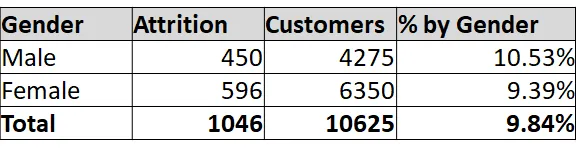
We see that there is a higher attrition in women vs. men. However, the attrition rate is lower in women vs. men. Do we create a marketing campaign to retain women or men?
You're asking the wrong question!. It's not about whether we should market to women or men. We should be asking ourselves if the attrition for women vs. men is statistically relevant. There may be a better way to recapture the attrition if we look at other demographics like age or location.
A Chi-Squared test can be run for any type of A/B testing to determine the statistical significance of one group vs. another. If we run this test, it turns out that there is no statistical difference between the attrition rate of the two genders at a 95% confidence interval. This tells us that we should be looking at different subsets of our data before making a decision.