ArtByte (ABYUSD) has broken out of the triangle pattern in the daily chart.
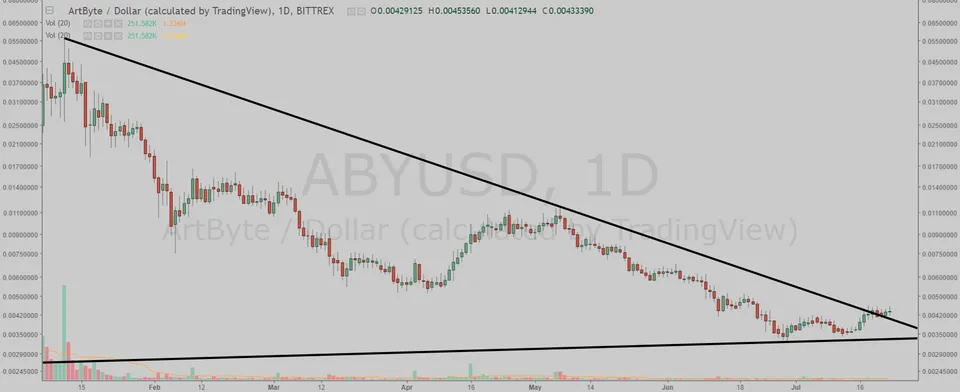
(Chart courtesy of Tradingview.com (log scale))
Elliott Wave Analysis
In Elliott Wave terms, ArtByte began a wave one advance in February 2016. The red wave one (blue sub-waves i-ii-iii-iv-v) finished on January 11 this year, and the red wave two (blue sub-waves a-b-c) correction ended on June 29. If this wave count is correct, ArtByte should be heading next towards the January 11 peak in the red wave three.
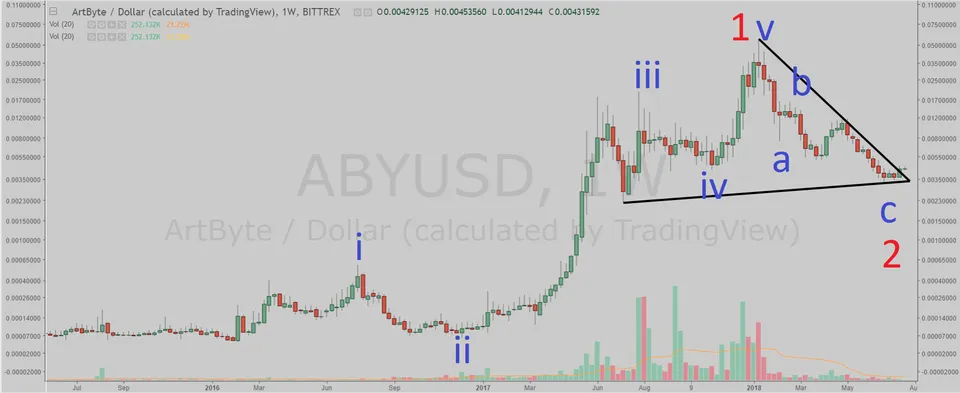
(Chart courtesy of Tradingview.com (log scale))
Funnymentals
ArtByte is a cryptocurrency combining features from Litecoin, Peercoin, and Dash with fast and secure transactions. You can view the full official introduction video below.
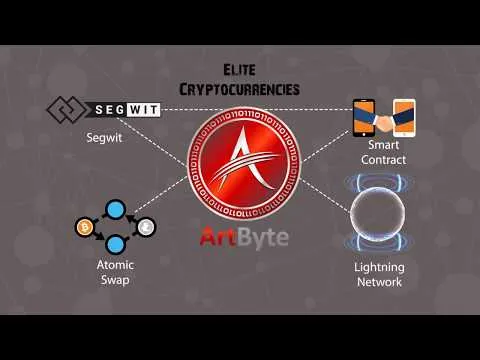
(Sources: https://www.artbyte.me/ and YouTube)

If you think this analysis is correct, upvote this post (min $0.01) and upvote the comment (min $0.01) "ArtByte will takeout the May 7 peak".
If you think this analysis is wrong, upvote this post (min $0.01) and upvote the comment (min $0.01) "ArtByte will drop below the June 29 low".
If you think ArtByte is in a range, upvote this post (min $0.01) and upvote the comment (min $0.01) "ArtByte will stay in a trading range between the June 29 low and the May 7 peak until August 27".
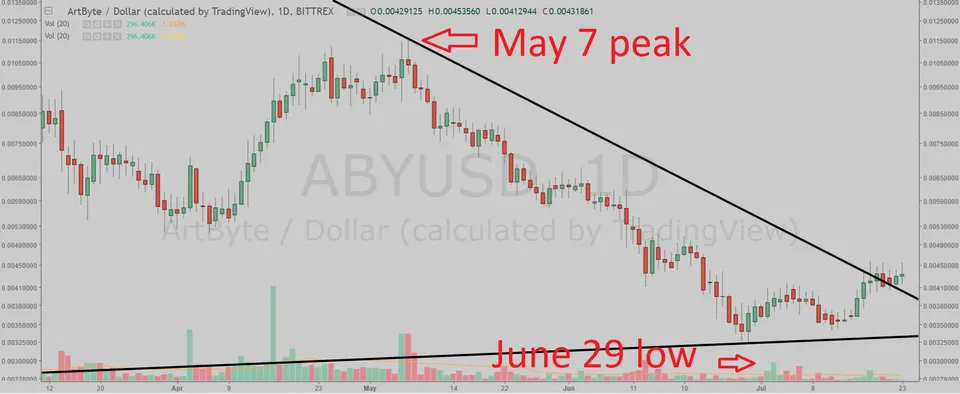
(Chart courtesy of Tradingview.com (log scale))
You can upvote the comment until 3 PM EST July 26 and you can upvote only one comment. 50% of SBD from this post will be distributed equally to the winners. The winners will be determined by the price action (which one happens first).
Bonus
I will be sending one Trophy Token (@trophy-token) to everyone who manages to get these crypto contests right seven times in a row. If/when you accomplish this, please contact me at Steemit Chat with your BitShares address.