
This article will extend on my previous piece on the use of stop loss orders to minimise trading risk.
You can read my first article here:
Do you want to be a better trader?
It discussed some of the basic principles of employing a stop loss’s trading strategy to help you to avoid large losses when trading crypto currencies. This article will expand on this topic and will seek to answer the question posed to me by @terrylovejoy which was posted in the comments section of the previous post. Terry’s comment was as follows:
Any thoughts on how you set your stop loss %. For crypto's would it be higher say 20% to avoid being taken out during a spike? Is there some guidance based on previous price action variance?
The short answer is yes. The slightly longer answer will be the subject of the remainder of this post.
How to Determine Your Stop Loss Percentage
There are a lot of different methods that you can use to determine your stoploss percentage. The simplest are based purely on how much money you are willing to lose. This was the type of example I used in my previous post. If you are to enter a trade and are only willing to lose a maximum of 10% of your original investment, then you set your stoploss 10% below your purchase price. This is easy and can be effective, however can also bring you unstuck if you employ this style of strategy without thinking about. The problem is that such a simplistic strategy takes no account of the volatility of the underlying asset. If the investment that you are buying regularly moves up or down in price by more than 10%, then having a 10% stoploss means you will likely be forced to sell out of the trade simply due to daily market fluctuations. When trading volatile assets such as crypto currencies this is a real risk. There are several more sophisticated ways to approach this problem.
For the technical analysis fans amongst us there are a variety of different methods involving support and resistance points in some form or another to determine an appropriate stop loss position. I am not a technical analyst so I will not be discussing these types of strategies. If this interests you however, there are a variety of different ways that you can use technical analysis to determine an appropriate stoploss level that maximises your chance of a profitable trade. Some resources that I came across while researching this post that might be useful can be found at the end of this post.
My focus when using stoploss is purely preservation of capital. I’m not trying to time the market as such, I’m simply trying to take a position in an asset that I think will rise in value while still having some protection that I won’t lose all my money if (when) I’m wrong.
When trading crypto currencies there are three things that you need to consider when determining your stoploss.
- The amount of money you are willing to lose on any given trade. In other words, how much risk are you willing to take.
- The level of volatility of the asset that you are purchasing.
- The correlation between the movement of your asset and bitcoin.
The third point is somewhat unique to crypto currency trading. In essence it deals with the fact that when you’re trading in crypto currencies you are quite often concerned with how much money you will lose in fiat currency terms. Your trades however are most often completed in reference to the Bitcoin price. When the market is falling steeply, which is when stop losses are most likely to help you, it’s highly likely that your investment and Bitcoin will both be falling in price at the same time. If you do not take this factor into account when determining your stop loss you can end up losing significantly more money than you intended by having an inappropriately placed stop loss order. I’m still researching this issue and will write a subsequent post once I feel I’ve come up with a suitable way of dealing with this. For the remainder of this post I will focus on the first two points shown above.
How Much Money Am I Willing To Lose
This is somewhat of a personal decision. A general rule of thumb for professional day traders is that no trade should risk more than 2% of your total capital. Whether you choose to adhere to this rule or not is completely up to individual preferences as an investor. The fact that it is so widely accepted however leads me to believe that it is probably a pretty good starting point. As I have covered in previous posts, it’s much harder to make your money back, than it is to not have lost it in the first place, so you need to have at least put some thought into this issue to make an informed decision. It’s also not as restrictive as it sounds. You could make 10 separate investments and each separate investment could have a risk of loss of 20%, and you would thus satisfy the 2% rule as no individual trade would cost you more than 2% of your overall portfolio if it moved against you. You can still take risky positions whilst adhering to sensible capital preservation rules. If you think through the problem logically the riskier the asset is that you are investing in, the more thought you need to give to how much money you are willing to lose before you acknowledge that you are wrong and you exit the trade.
On the completion of this series of posts, I plan to establish a portfolio on binance valued at $10,000 and employ the strategies that I have outlined for you. I will then post regular updates as to the performance of this portfolio so that you can see whether the strategies are effective. I will be utilising the 2% rule in management of this portfolio.
How Does Volatility Affect Your Stop Loss Level.
Volatility is very important when considering stop losses. As indicated above, the point of the stop loss is to prevent you from large losses, not to prevent you from any loss at all. If you place your stop loss to close to your initial entry position, then in all likelihood your stop loss order will be triggered simply due to normal daily fluctuations in the price of the asset. To use a specific example, if you are buying an asset that you know regularly moves up or down in price by one dollar on any given trading day, then having a stop loss 50c below your purchase price means that you will most likely be forced exit before the trade has a chance to be profitable. These daily fluctuations in price are sometimes known as noise, and your stop loss must be set such that it is not triggered by routine noise in the market.
It is at this point that we must turn to statistics to help us determine an appropriate stoploss level. It’s important to note that as the volatility of each individual asset that you purchase will be different, it’s highly likely that the stoploss that you use for each individual asset will also be different. Fortunately, a lot of people who are a lot smarter than me have been doing this for a lot longer than I have, so there is an enormous amount of information already available on the Internet to assist us to work out an appropriate stoploss.
As I indicated above, stop losses are commonly employed in technical analysis trading strategies and therefore a large amount of work has been done by technical analysts in the past to solve some of these problems for us. The most appropriate method for determining a stoploss for the strategies that I’m trying to employ is a concept known as the average true range (ATR).
What is the Average True Range (ATR)
The Average True Range uses statistical analysis to determine how much on average an asset will move up or down on a given trading day. Whilst the average true range is quite easy to calculate from a mathematical point of view, it is also quite manually intensive and therefore not something that I would recommend you attempt to work out for yourself unless you have an interest in statistics. Fortunately it’s a fairly common technical indicator and most good quality charting websites and programs will have a feature which will automatically calculate the ATR for you. The best way to understand the ATR is by reference to the following diagram.
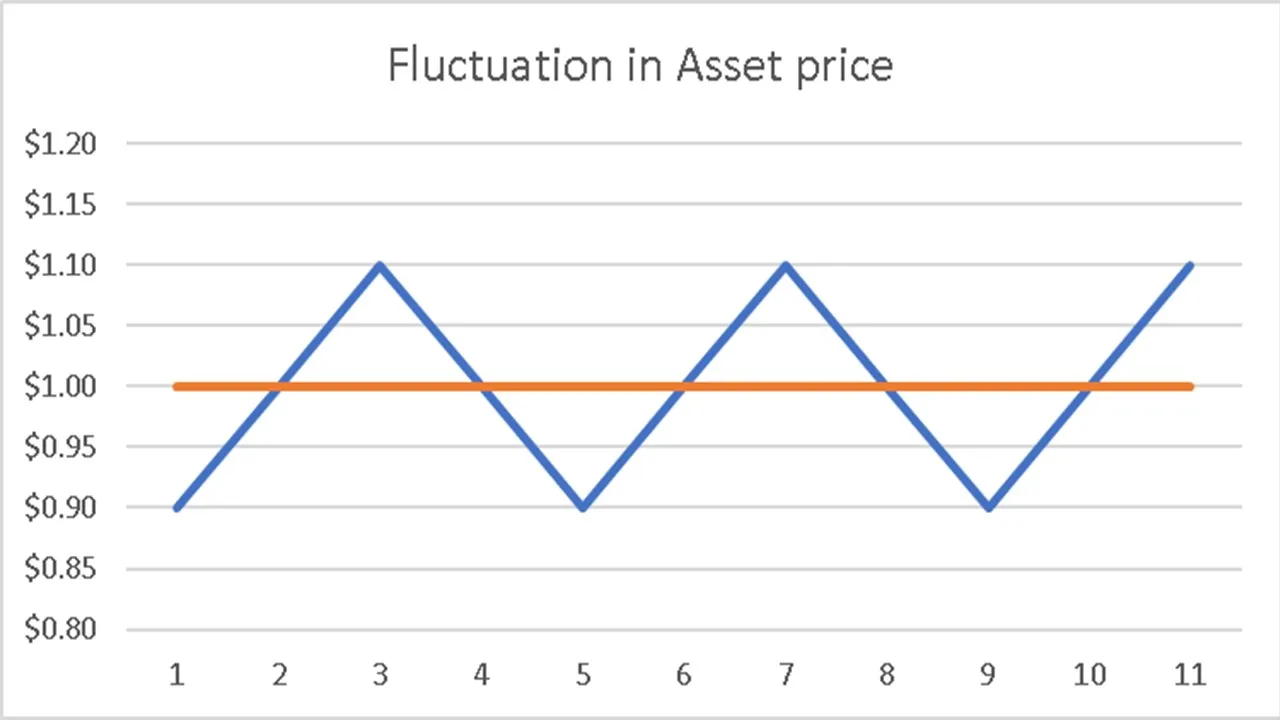
As we can see in this example we have a coin that is worth one dollar, that we know is likely to move up or down by approximately $0.10 on any given day. In its simplest terms the average true range for this coin is likely to be approximately 10%. The statistical calculation of the ATR is a somewhat more complicated than this, but this example is sufficient to demonstrate the concept.
When we establish our stoploss we want to ensure that the distance between our initial purchase price and our stoploss is greater than the average true range. By doing this we ensure that we are not stopped out of the position by market noise. How much above or below the ATR we wish to set our stoploss is largely a matter of judgement and experience. Most of the literature that I reviewed in preparing this post referenced a level of approximately two times the ATR as a reasonable starting point. So, if we wanted to enter a trade to purchase an asset worth $1, with an ATR of 10, then we could set our initial stoploss at $0.80.
Stop loss price = purchase price – (2 x ATR)
= $1 – (2 x $0.10)
= $0.80
This allows the price of the asset to fluctuate by twice is daily volatility before we need to be concerned about our stoploss order being executed and our position being closed.
To give a real example, the current price of Steem as I write this article is $3.42. The ATR is almost exactly $0.10. Using a multiple of two gives us an initial stoploss position $0.20 below our purchase price, or $3.22. So, if we wish to enter a position in Steem today using a stoploss based on the ATR, our stoploss would execute if Steem fell below the price of $3.22. If we automate our trade using a exchange such as Binance or Poloniex which allows us to enter stoploss orders in advance, this would mean that the maximum amount of money that we have at risk is approximately 5.8% of our original investment.
Concluding Thoughts
As with anything related to investments, it is never as simple as it seems. It is important to understand that the ATR is a dynamic indicator. This means that it is based on the average of the daily fluctuations in the price of the underlying asset over a certain period of time. The Steem price recently has been quite stable. Even though it has fallen over recent weeks, it has fallen in steady increments and has not suffered any significant price falls on any specific day. Thus the current ATR is relatively small. If the volatility of the Steem price increased significantly in the future, then the ATR also increases which means you may need to increase the size of your stoploss.
There are two ways to manage this factor. The first is to regularly monitor your portfolio and adjust your stoploss positions based on the current ATR. Or alternatively you can simply use a larger multiple of the ATR to give your trade greater room to move before your stoploss is executed. If you were to use a multiple of four times ATR instead of two times ATR then this would allow your position to absorb significantly greater volatility in the Steem price. The cost of doing this would be that you would double the level of risk that you are taking in your trade. If you double the ATR in our example above, then your risk increases from 5.8% to 11.6% of your invested capital. If you play around with these types of strategies, you will soon learn through experience where you are comfortable.
Summary
When placing a stoploss order after entering a trade it is essential that you place the stoploss order far enough from your entry position that it is unlikely to be triggered by routine fluctuations in the price of the assets that you have purchased. There are a variety of methods of determining where to place your stoploss. The method which I think most appropriate for my personal needs is the use of a technical indicator known as the Average True Range (ATR). Sensible use of the ATR will allow you to place stoploss orders that minimise your chance of being forced to sell out of a position simply due to routine day-to-day market fluctuations while still protecting you from a large losses should the price of your investment fall significantly.
If you are interested in the statistical calculation that goes behind the ATR you can find more information here.
If you are interested in other technical indicators that will assist you to determine your stop loss position you can find additional resources here, here and here.
Main image by Olu Eletu on Unsplash
Written with StackEdit.