Hello Steemians! I was just reflecting at the BTC chart this morning. Let us have a look:
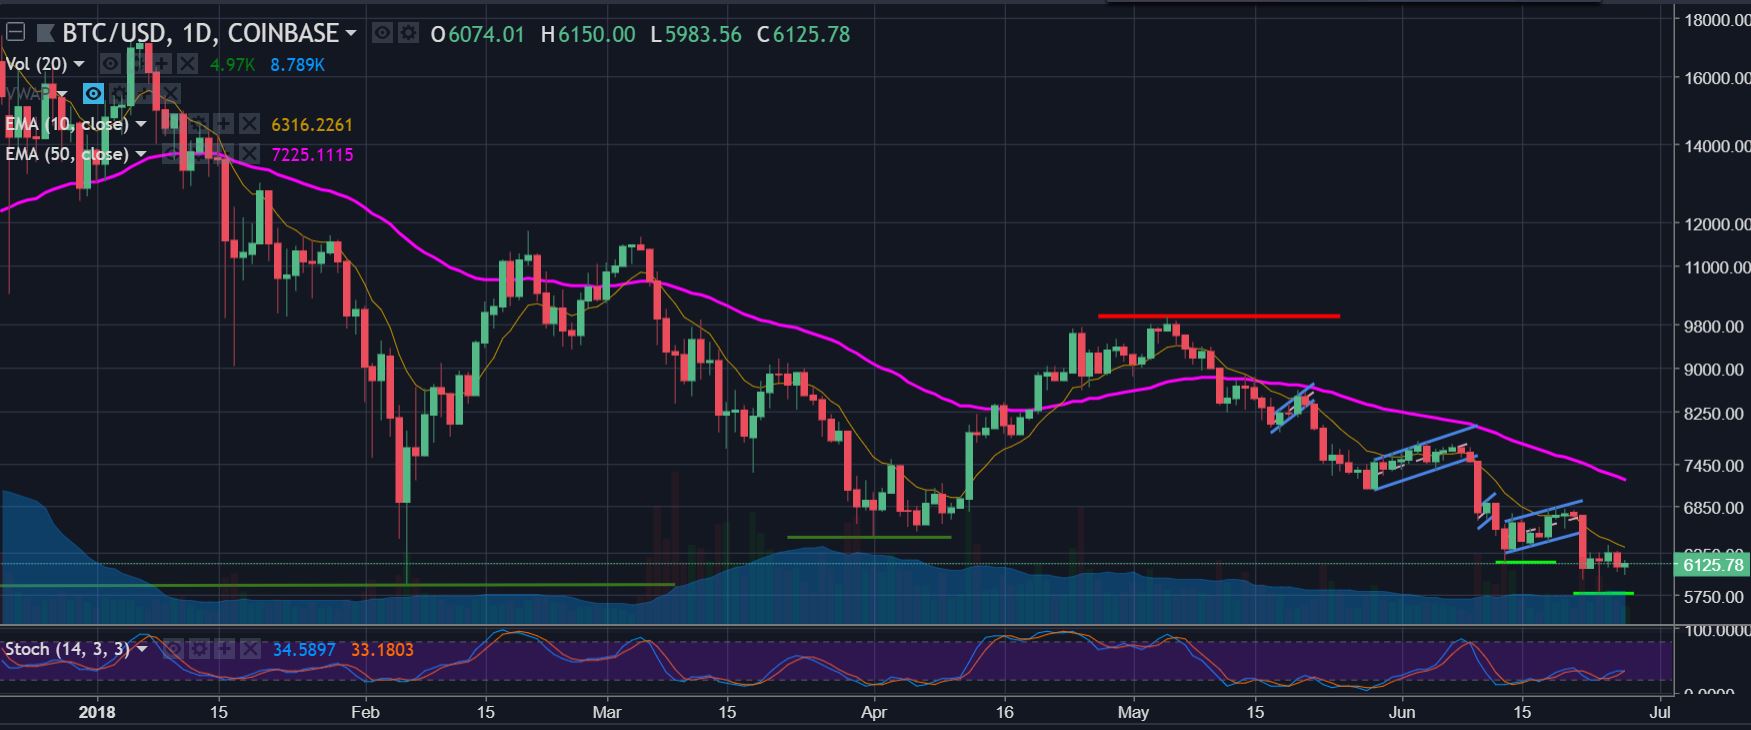
What a year this has been! In December and January people were euphoric! My Uber driver and my neighbor started asking me if I have put some money into bitcoin. I remember near late Nov, around thanksgiving in the US, BTC used to rally 1000 points a day, every day! Oh boy! Those were good times. Fast forward 6 months, and it feels like that never even happened. We reached 5800 recently, and trying to stage a rally. I have seen many bottoms in many different currencies, stock indices, commodities... they come is all shape and sizes. So please don't let others tell you that they "know" how a bottom forms and forming. Because nobody knows for sure. I have no idea. Sometimes bottoms are spikes like the US stock market bottom in 2009, or Crude oil prices in 2009 and 2016. But other times, it is long and painful sideways action, like Gold prices from 2016 to now. So, the bottom line is we do not know. Shorter term charts still showing a lot of weakness.
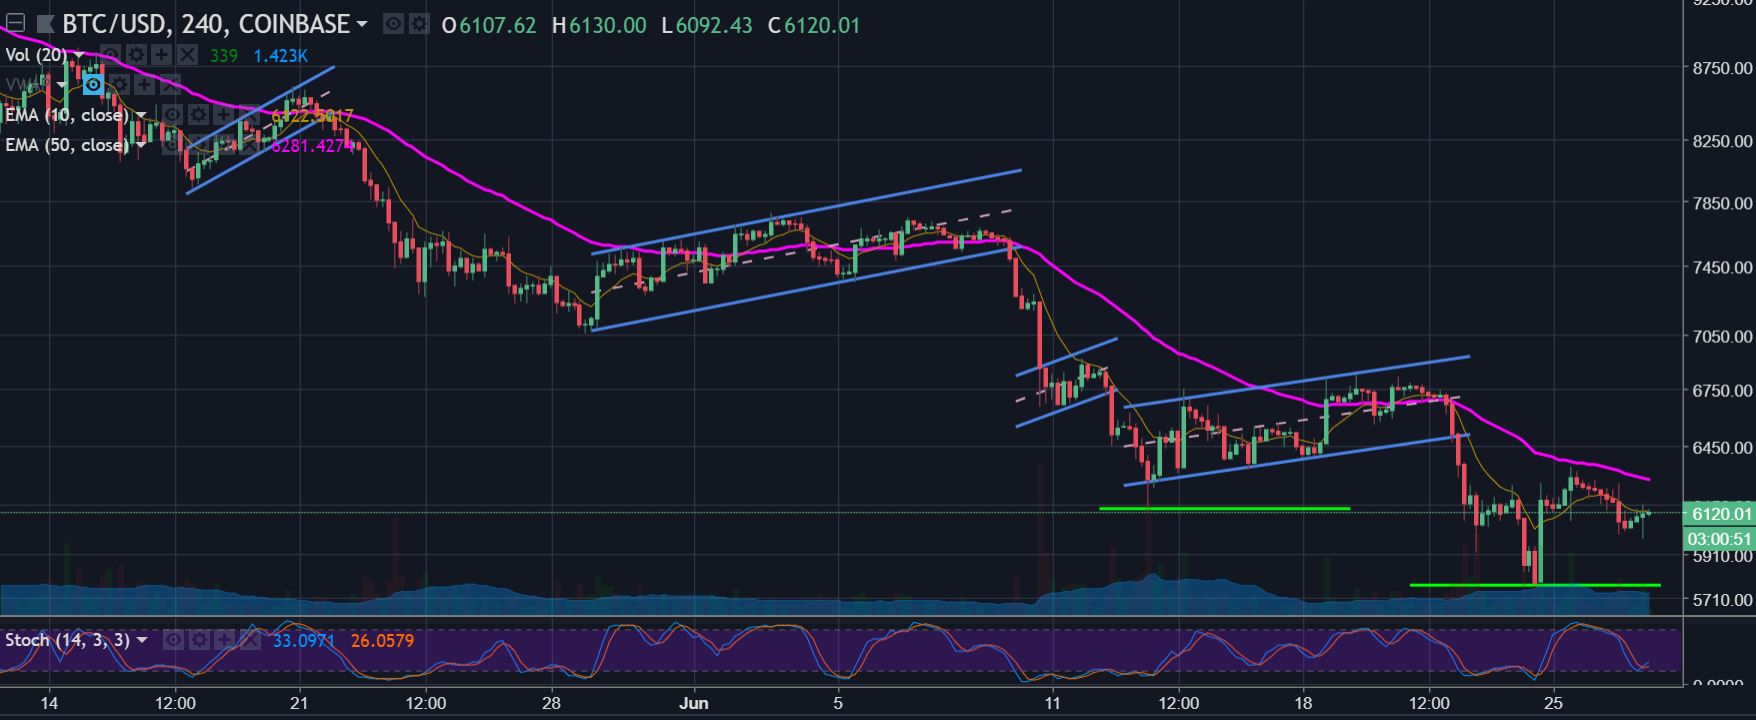
The 4-hour BTC chart above is still showing the channel - break to the downside pattern. The latest few candles are dis-organized, which is a good sign. That means, some other pattern might develop. I have no idea what that is, but it will be interesting. That is why I say bottoming is a process, and we get to observe it.
Disclaimer: This is NOT professional advice, this is all just my own opinion and experience. I am NOT a Certified Financial Adviser. Consult professionals for any financial, accounting or legal related questions you have.
Charts are created in Tradingview.com, which is a free service