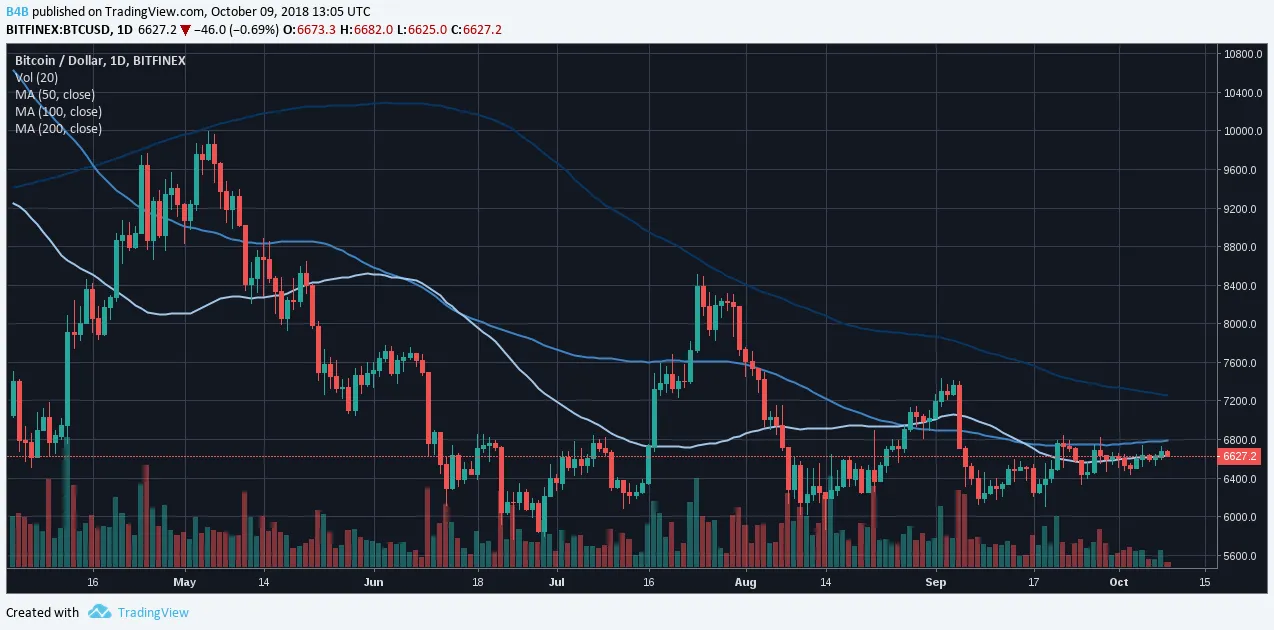
Similar to the weekly simple moving averages chart we can see a resistance near the 7k price level on the daily chart, using 50 days / 100 days / 200 days to analyze mid-term and long-term development.
The 200-day MA hasn't even been touched once since March. Attempts to break through the 100-day MA have been rejected. In the next couple of weeks we will see if the price manages to overcome the 200-day MA or if the price is being pushed lower to new lows.
Disclaimer: I am not a financial advisor. The crypto market is very volatile, make your own conclusions and invest at your own risk.