Right click the image and open it in another tab to view the text. Alternatively, below is the text:
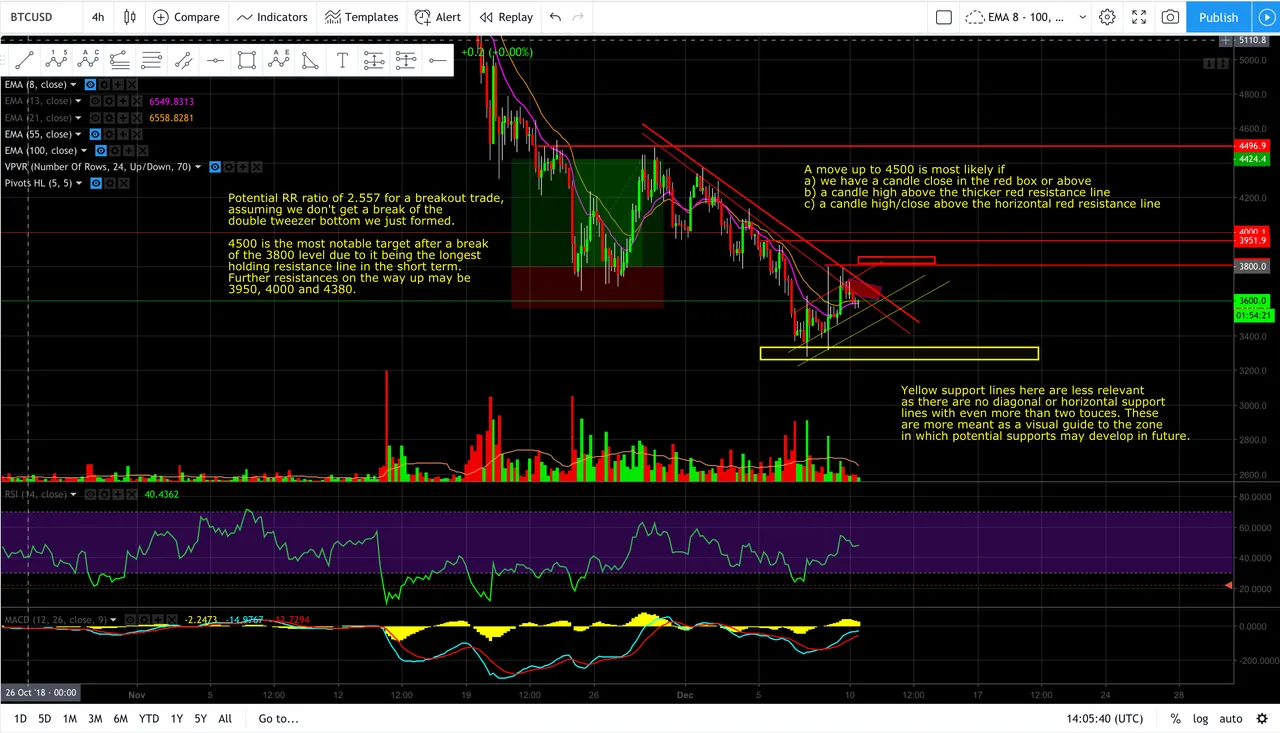
Potential RR ratio of 2.557 for a breakout trade,
assuming we don't get a break of the
double tweezer bottom we just formed.
4500 is the most notable target after a break
of the 3800 level due to it being the longest
holding resistance line in the short term.
Further resistances on the way up may be
3950, 4000 and 4380.
A move up to 4500 is most likely if
a) we have a candle close in the red box or above
b) a candle high above the thicker red resistance line
c) a candle high/close above the horizontal red resistance line
Yellow support lines here are less relevant
as there are no diagonal or horizontal support
lines with even more than two touces. These
are more meant as a visual guide to the zone
in which potential supports may develop in future.
I recorded a video explaining everything but for some reason it always takes at least 3 hours to upload the video and if my laptop accidentally shuts down within that time, I have to restart the upload. In any case, here is the explanation video which I recorded yesterday.