
Image Source
I am planning to buy some Bitcoins for myself as i currently only own Steem
While doing some research on Bitcoin i came across this beautiful chart which i wanted to share with all
I could not believe how much similar the 2014 and 2018 charts were
This first comparison was published by D4rkEnergY so full credit to him
Now i might be wrong but i think we are headed more down before coming up.Thats certainly what the chart is suggesting
THE SIMILAR 2014 AND 2018 CHARTS
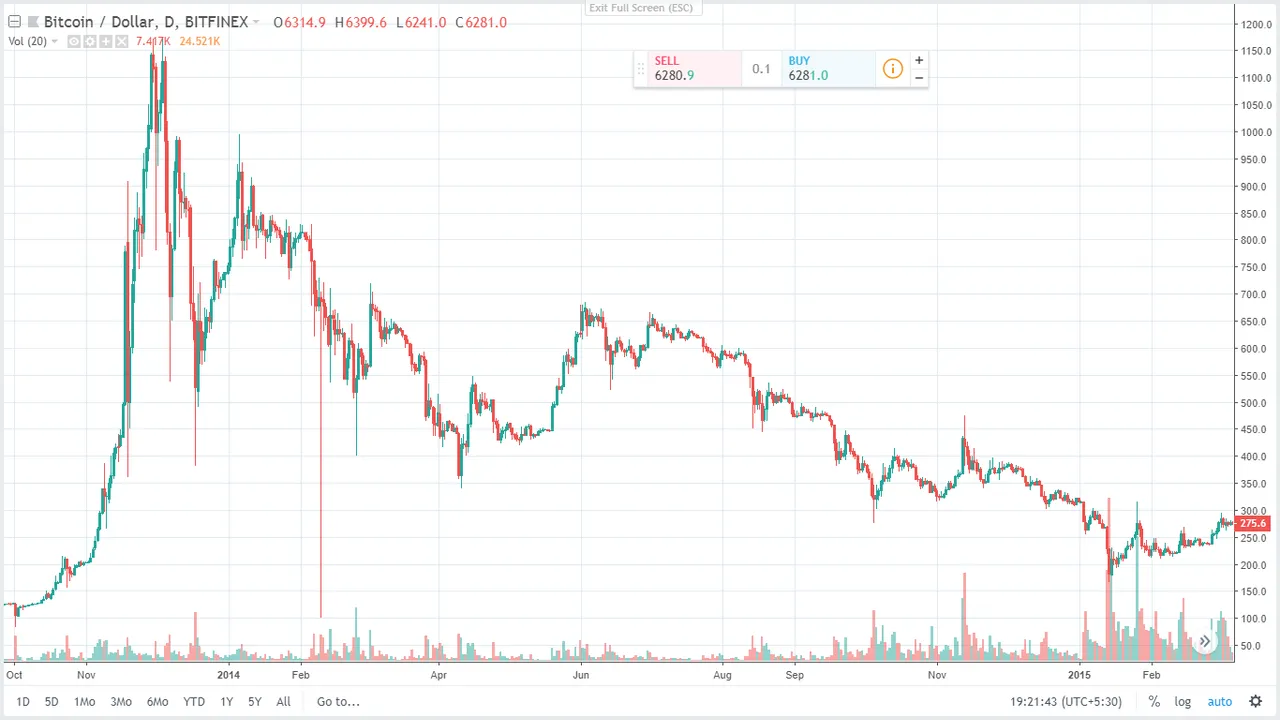
2014 Chart
 2018 Chart
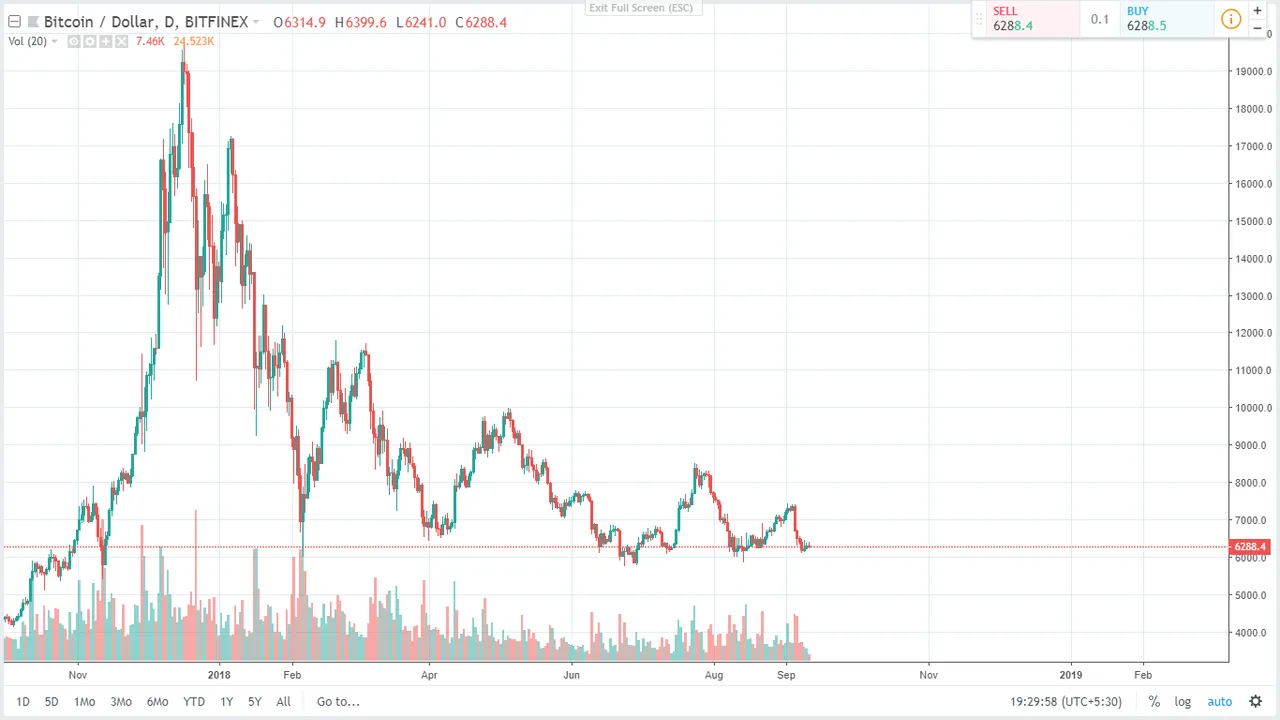 From the Tops to the Lows everything looks so similar
So as per the 2014 chart we should be heading more downwards during the month of October?
Or may be i am reading it wrong and there is no comparison at all?
I could really use some help.Should i wait for it to dip more or is this the last dip?
Let me know your comments and thank you for reading.I really enjoyed this :)
From the Tops to the Lows everything looks so similar
So as per the 2014 chart we should be heading more downwards during the month of October?
Or may be i am reading it wrong and there is no comparison at all?
I could really use some help.Should i wait for it to dip more or is this the last dip?
Let me know your comments and thank you for reading.I really enjoyed this :)
Lots of Love
Alice