CryptoKraze here

Possibility on 30 Minutes Chart
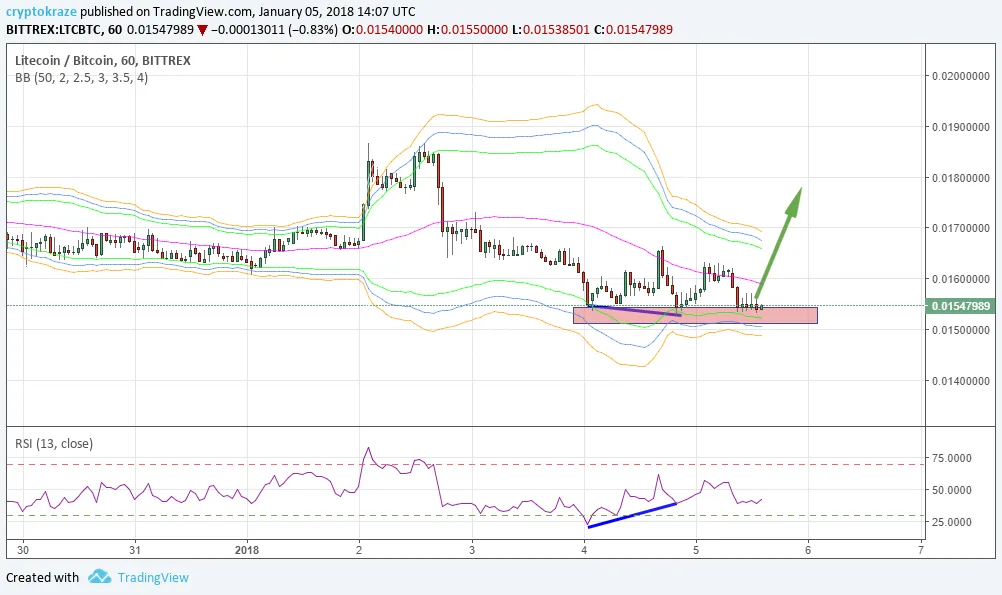
If you look at the 30 minutes chart, you will see that a bullish divergence has formed because price has made lower lows and RSI is making lower high, which mean blue lines are going opposite direction. RSI has gone below 30 level and now moving nicely above 30 level, so I am expecting it to go even higher. Price has touched the lower bollinger bands and now it will move up nicely. I have taken this trade as a scalp to make some quick profit.
- I have a buy entry at 0.015100 with my profit target will be around 0.016700 or above.
- Stop loss just below the entry area is must for trading if you don't know the Averaging Technique in Crypto Trading.
Crypto Trading is risky business and you can loss partial or full amount of money. Trade at your own risk with that money only you can afford to lose. Bitcoin unexpected move will make this analysis void.