Hello all,
As I received many positive messages about my previous learning topic : Learn the Trading #2 : BTC - How to know the price target of the pattern "Head and Shoulders", I decided to continue the serie and to propose you some more tips about trading.
Today, we will do it on the current chart of STEEM :
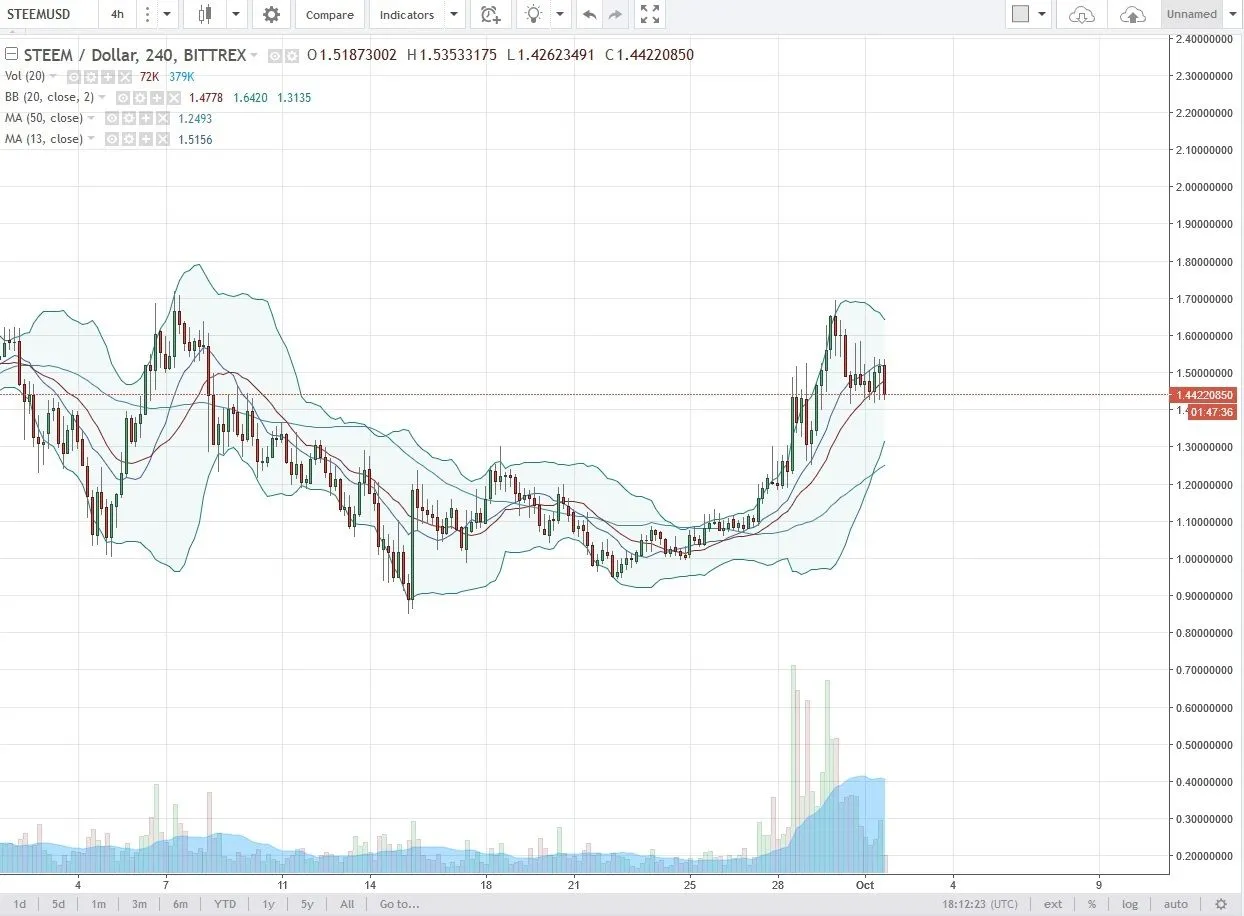
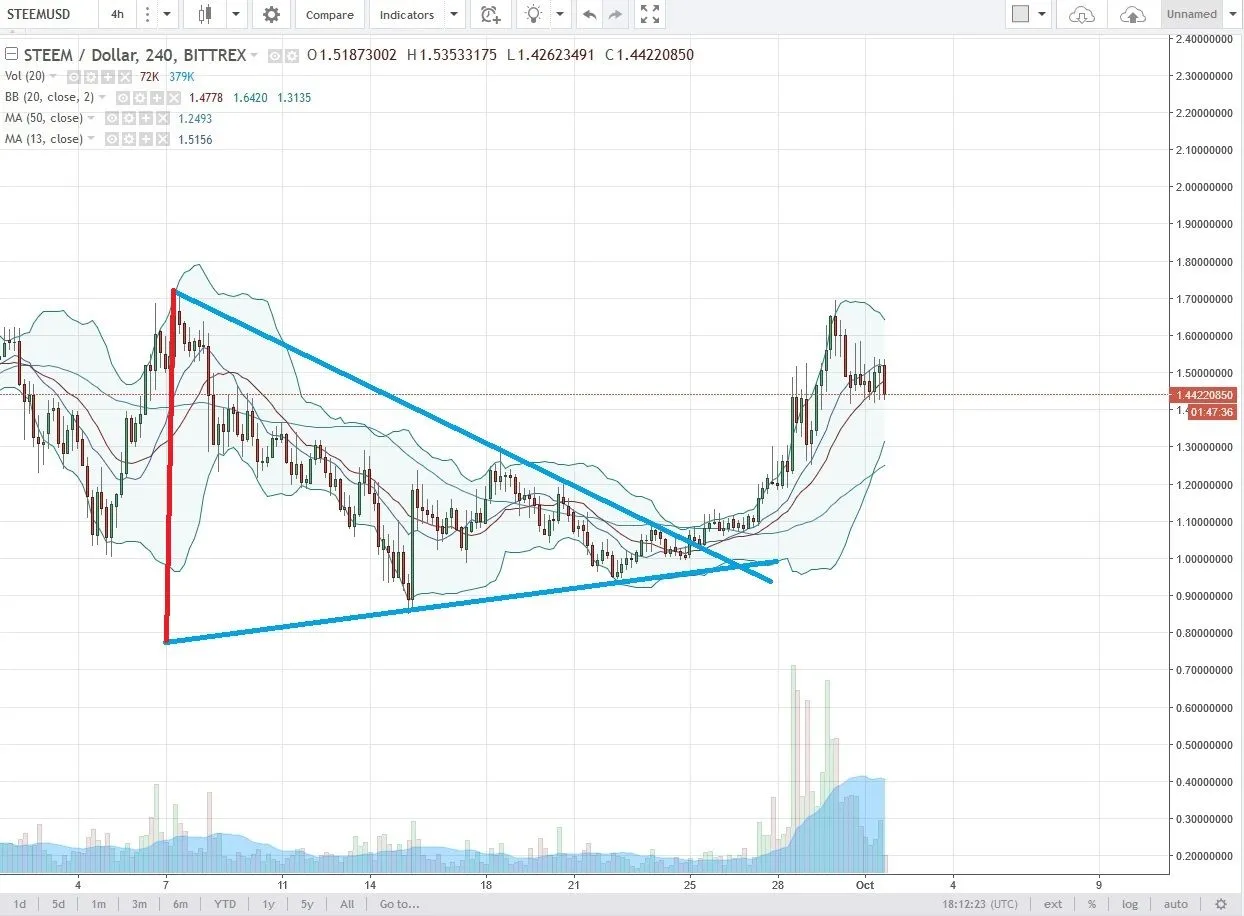
Here we can see the triangle that STEEM broke during its break out :

Now we try to determine which level of price STEEM could reach after its break out. So first we trace a red line at the start of the triangle :
When this red line is traced, move it at the intersection of the 2 lines on the right. Use now the start of the triangle at left and that red line to trace an horizontal line which is parallel to the bottom line of the triangle :
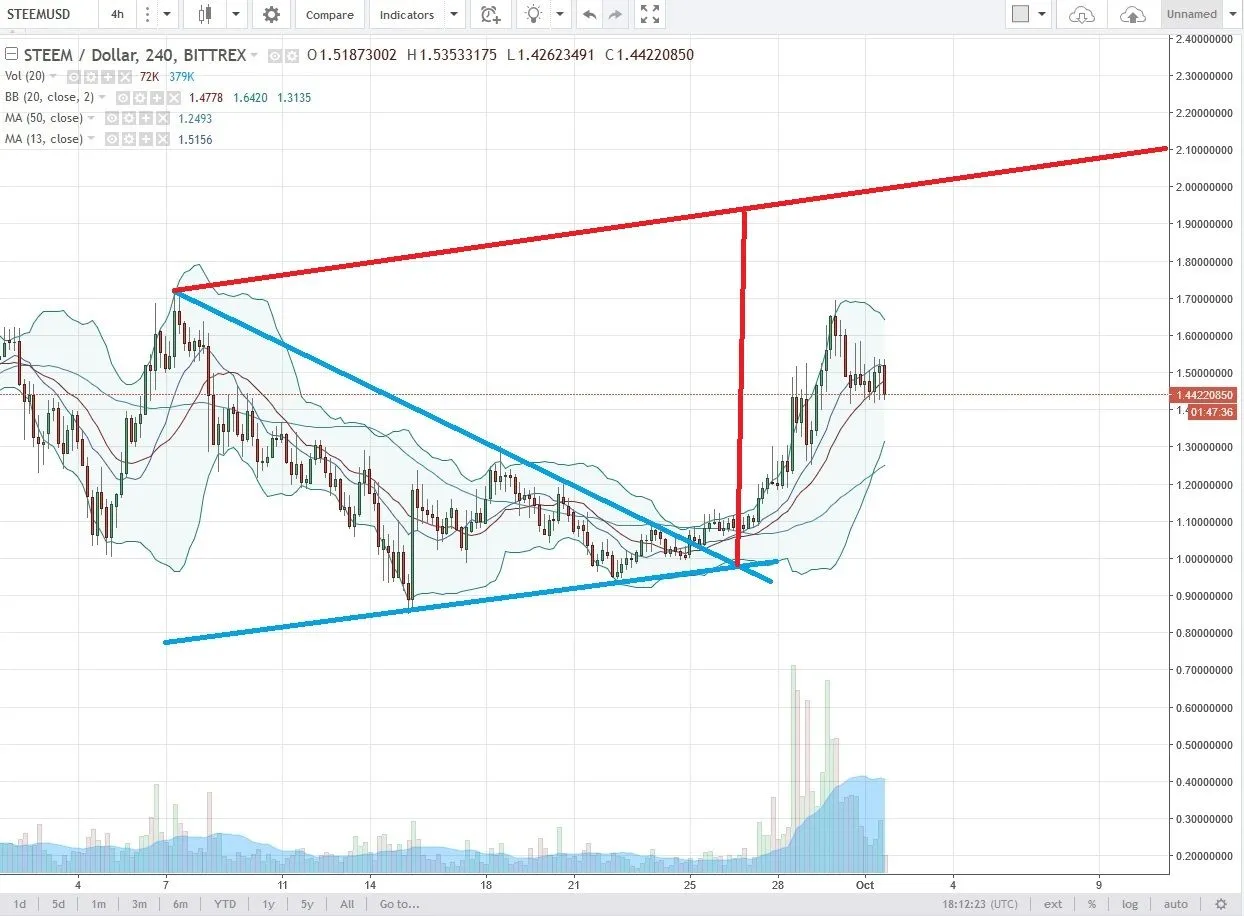
You can now use that parallel line to have an objective of price for this break out :

Never forget that all this is not an exact science but it can help you a lot to determine an exit point for your trading.
Take care all,
Cryptopassion.io
Disclaimer : Never invest more than what you can afford to loose. This post is my personal opinion, do your own research before making any investment decisions. If you make any trades after reading this post, it is completely in your responsibility. I am not responsible for any of your losses. By reading this post you acknowledge and accept that.
Version française ici : [FR] Apprendre le Trading #3 - STEEM - Comment connaître le prix cible d'un triangle cassé par un break out