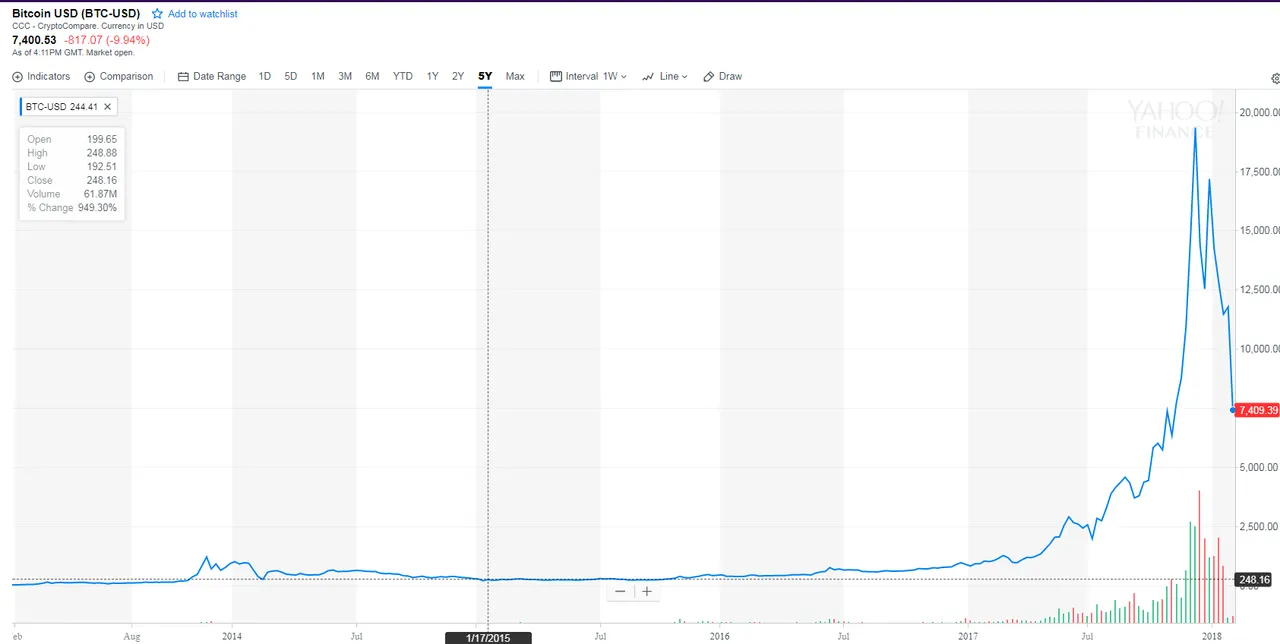
I must say that the historical bitcoin graph looks like classic pump and dump 0_0
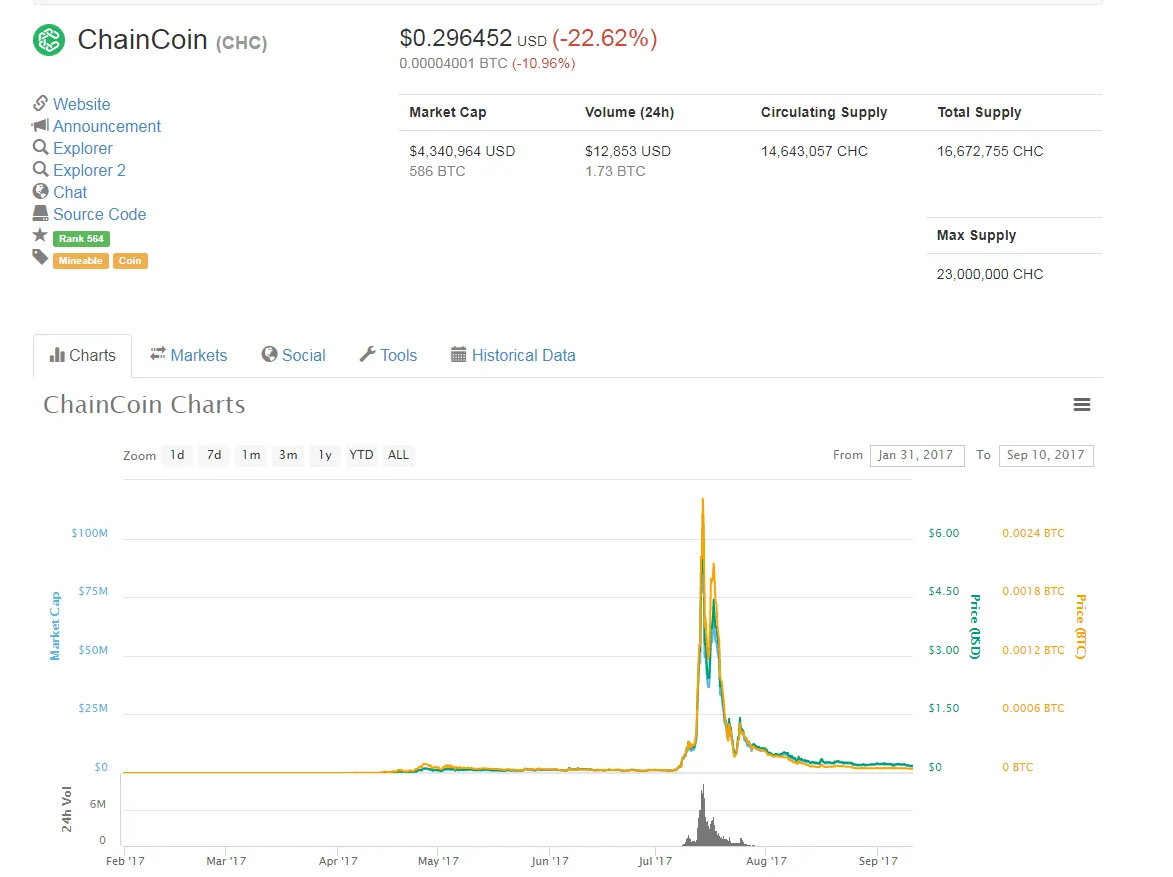
The pattern of pump and dump is huge spike, then fall, then second wave (a smaller one), fallowing total destruction.
Lets look at ChainCoin, well known pump and dump, and the HODL movement...
https://coinmarketcap.com/currencies/chaincoin/

Now look at Bitcoin 5 years
https://finance.yahoo.com/chart/BTC-USD

I hope it is not the case, yet from technical point of view...