elnoiv's Triweekly Bitcoin market analysis update!
In this piece of analysis, I will be discussing the technical tools that have indicated the direction in the market, along with the price targets and what to watch out for. All of the information provided is speculative and any investment should be considered independently.
After yesterday's across-the-board greens on the crypto market, it seems like Bitcoin will be embarking on its recovery wave of the bearish trend since the high on 24th July. Having bottomed and gained ~9% since earlier this week it seems we could be expecting another move upward to higher highs in the following week, toward the price targets of $6767.80 followed by $7102.90.
Here is the current chart for Bitcoin along with my analysis:
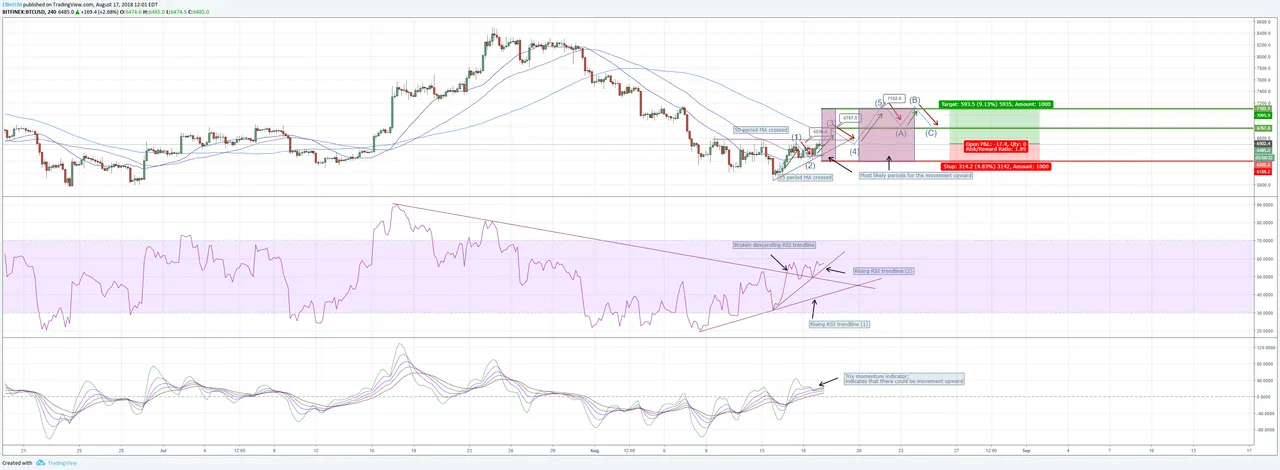
We have lots of good indications that Bitcoin has finally bottomed and that bullish movement is to be expected relatively soon from the chart above.
First of all, we have both the 25 & 50-period moving averages crossed by price action to the upside. The RSI is also looking increasingly optimistic, being in a healthy uptrend. Our Trix indicator also indicates gaining momentum upward (having already crossed the baseline into the uptrend). It also looks to be that we are currently in Elliott Wave (3) heading toward the price target of $6767.80.
What to watch out for!
Price Levels
The price levels people should watch out for is the current price ($6530.40), the next closest Fibonacci price level ($6767.80) and the following Fibonacci level up ($7102.90).
It seems likely that within the next few days the next Fibonacci price target will be reached in a small bullish run, followed by a speculative movement upward toward the further Fib level of $7102.90 (which would also clear the 100 period moving average solidifying the bullish intent in the market).
RSI
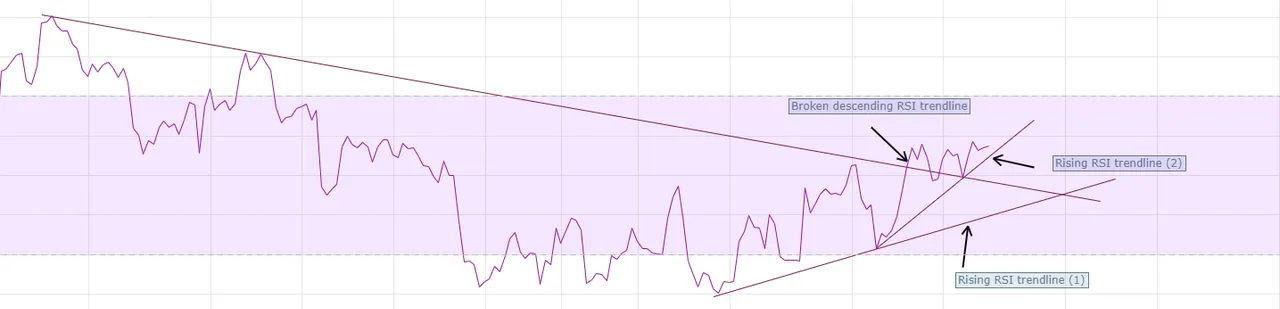
RSI is currently sitting at a healthy 57 mark, well below the overbought range.
You'll want to be watching RSI trendline (2) as indicated on the chart more than RSI trendline (1), if trendline (2) is broken you might want to consider that the initial price target of $6767.80 might not be reached in this wave up, and that sideways movement is expected.
As for RSI trendline (1), if it is broken, all hope for this attempt upward has failed and it is unlikely for the prices to hit both targets in the short term.
In a more optimistic note, the descending RSI trendline was finally broken less than 48 hours ago, suggesting that we will be heading into a bull run (fingers crossed).
Trix
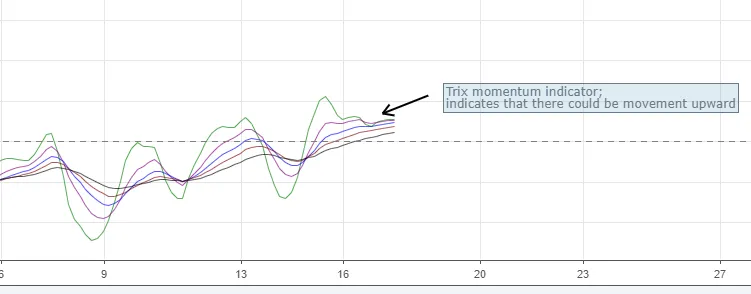
For the Trix indicator, it has finally cleared the baseline crossing well into an uptrend at this current time, allowing for further indication of a likely bull run in the short term.
Timeframes
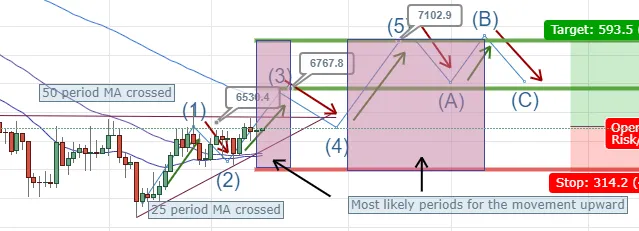
We are looking rather imminently for the initial wave upward toward the first price target ($6767.80) within the next 48 hours (indicated by the first purple zone), although keep in mind this is a speculative estimate using the cyclical timeframe tool.
The second purple zone indicated on the chart shows the timeframe in which it is speculated that the price could move upward toward the second target ($7102.90), depending on market sentiment I'm estimating the second movement upward to occur sometime next week.
However, do keep in mind that if the push up is to fail at any point, these estimates will be invalidated.
Conclusion
All in all, it looks highly optimistic for a bullish run in the short term (1-2 week timeframe) and we should expect good volume in trading.
Goodluck with your crypto investments and let's have our fingers crossed for another ~9% rise in price for Bitcoin.
-elnoiv