Regular daily update on BTC ta analysts opinions.

**My summary - short-term sentiment: slightly bullish ** (last: neutral)

BTC shows strength still pull back is expected before moving further up.
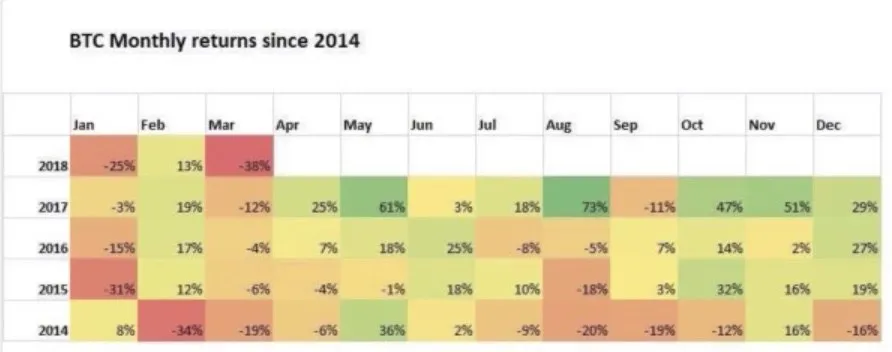
April is used to be a good month for crypto. Lets see how this turns out this time.
News about the blog
I need to revise my 2018 long term table. I need to add a 2018 and 2019 target an be more precise on the sentiment here. Will do that after I am back in Switzerland.
We lunched the bounty project beta. If you are interested and you like to create a bounty on your own have a look at this post
Analysts key statements:
Tone:
- Weekly: Weekly looks good and could lead us into a bull market. He still thinks the low is not in.
- Daily: We broke another resistance (setup trend line). He is looking for the price to pull into another death cross (128, 200 MA). If 9 come there he will think about a short play. He think about going bullish only if we break something significant (12'000+) or we pull back and reverse than with significant confirmation.
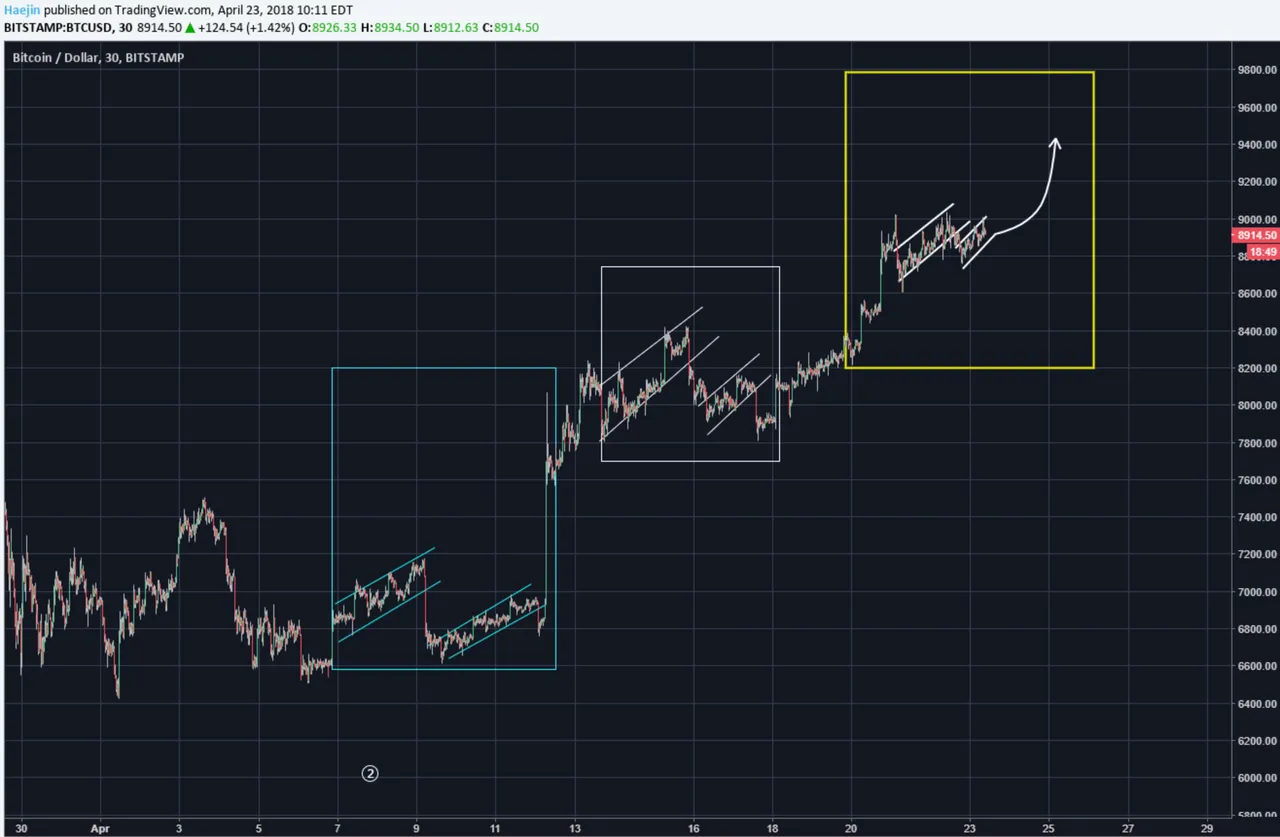
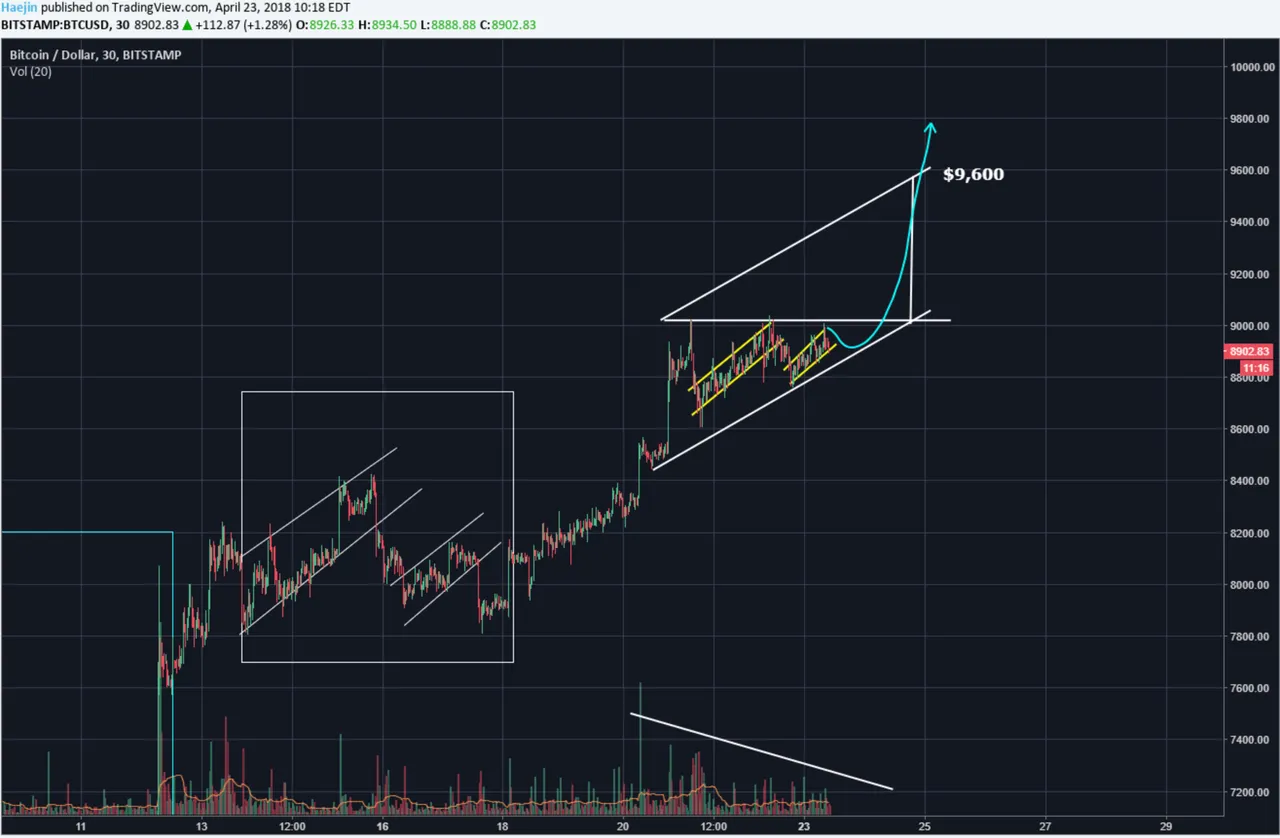
@haejin:

He sees another fractal ongoing. He believes we see higher highs in Bitcoin.
He also sees an ascending right triangle which is an even more bullish sign. Target 9'600.
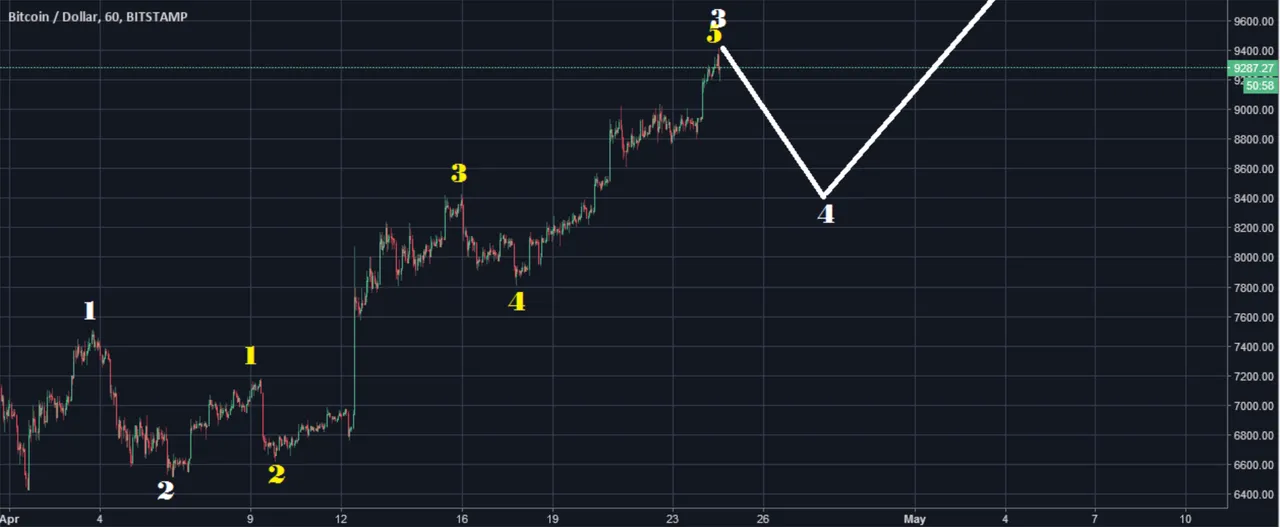
@ew-and-patterns:
He expects wave 5 to be completed soon followed by drop to 8'400 before going up again.
@lordoftruth:
Price failed to pull back as 5H expanded into a new bullish candle series. 1D displays stong resistance zone between 9'450 and 9'730. On 4h we look for reverse H&S pattern.
He expects move to 9'450-9'730 which will be April high.
Rejection and retracement to 7'300 - 7'640 (May Low).
Rise towards the potential target of H&S pattern at 10'170 - 10'400 - followed by 11'780 - 12'400 (June).
Todays trend is Slightly bullish. Expected trading for today is between 8'643 and 9'737.
@philakonesteemit:
Bullish scenario got confirmed. Possible further small wave up to come. See bull/bear scenarios below.

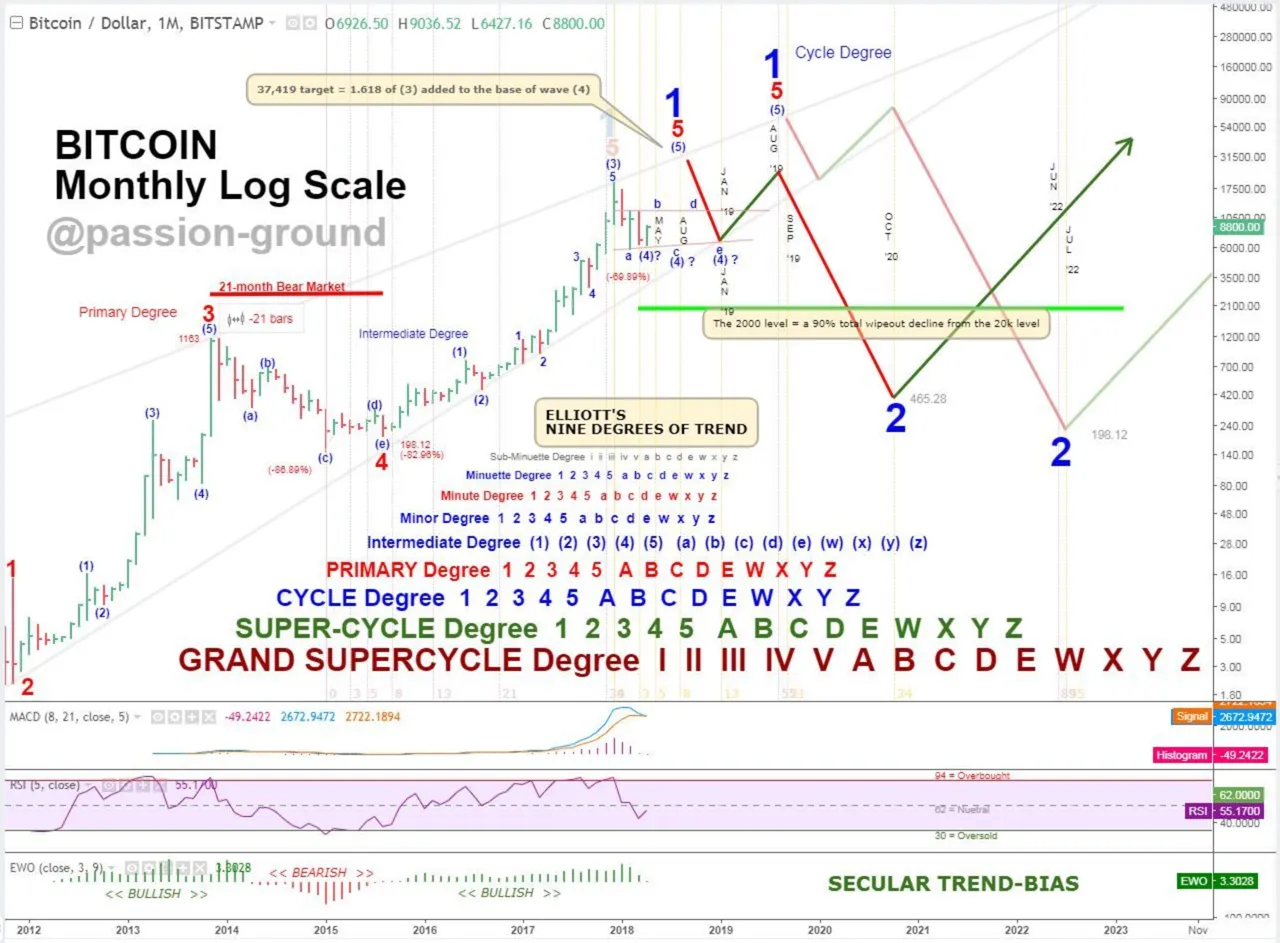
@passion-ground:
he secular trend is struggling like hell to remain bullish. The long-term trend (via the daily and weekly charts) are poised to reverse to the long side of the market come Monday.
Summary of targets/support/resistance


Reference table
| analyst | latest content date | link to content for details |
|---|---|---|
| Tone Vays | 24. Apr | here |
| @haejin | 23. Apr | here |
| @ew-and-patterns | 24. Apr | here |
| @lordoftruth | 24. Apr | here |
| @philakonesteemit | 24. Apr | here |
| @passion-ground | 23. Apr | here |
Definition
- light blue highlighted = all content that changed since last update.
- sentiment = how in general the analysts see the current situation (bearish = lower prices more likely / bullish = higher prices more likely)
- target = the next (short term) price target an analysts mentions. This might be next day or in a few days. It might be that an analyst is bullish but sees a short term pull-back so giving nevertheless a lower (short term) target.
- support/res(istance) = Most significant support or resistances mentioned by the analysts. If those are breached a significant move to the upside or downside is expected.
- bottom = -> now renamed and moved to long term table. Low 2018
- low/top 2018 = what is the low or the top expected for 2018?
Further links for educational purposes:
- From @ToneVays: Learning trading
- From @philakonecrypto: Like in every post you find links to his amazing educational videos. For example here
- From @lordoftruth: Fibonacci Retracement
- From @haejin: Elliott Wave Counting Tutorial
*If you like me to add other analysts or add information please let me know in the comments.