
Coin Telegraph
GOOD EVENING STEEMIT!
BITCOIN IS AT $5,000!
Well it was... While price has retreated today after tapping the hugely significant psychological level, like I said in yesterday's Litecoin blog, it's really just a healthy pullback.
So now the only question that matters is, how is price going to get back to $5,000 again?
As it's Sunday night and it's been a weekend I haven't really enjoyed, I wanted to just quickly share a couple of Bitcoin charts featuring the levels that I'm watching to see if price can find support and bounce out of to $5,000 and beyond!
BTC/USD Daily
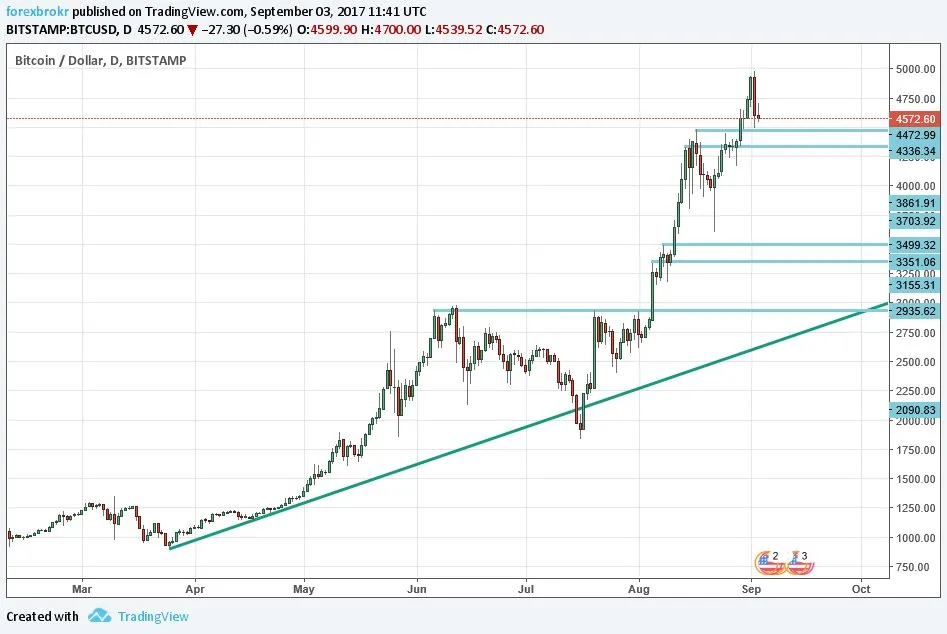
As you can see on the daily chart, there are some pretty significant swing high resistance levels that we want to keep our eye on when it comes to price pulling back to find higher time frame support.
First up, we have this $4,472 to $4,376 zone, which is actually in play right now (wait for the intraday chart below).
I know that there's a long way to go and it's not really what us crypto bulls want to hear right now, but that daily chart does show that a pullback all the way to $3,000 still means the confluence of daily resistance turned support and trend line support would still have held.
Anyway, that's a long way off yet.
BTC/USD Hourly
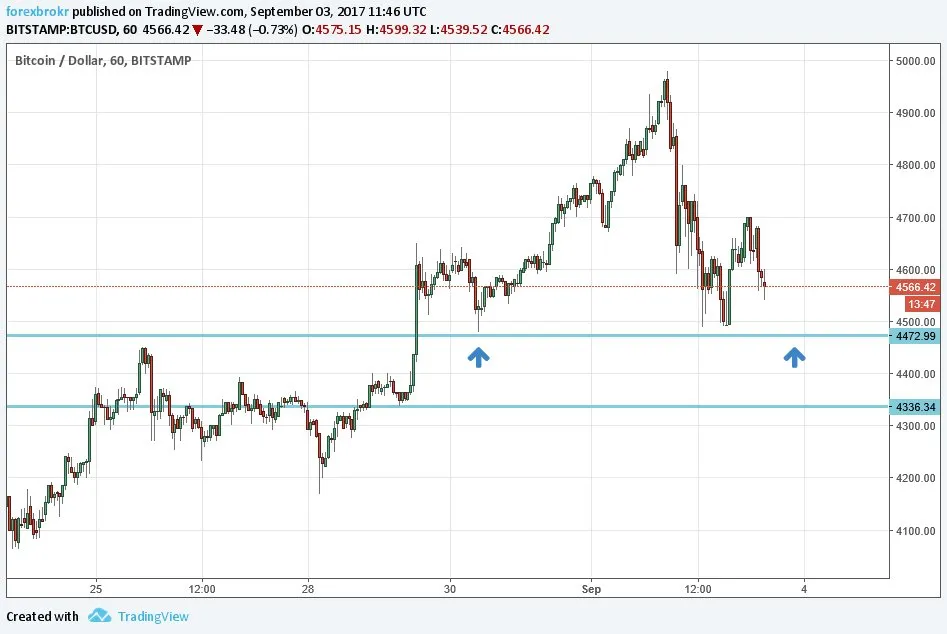
Zooming into the hourly chart and I've highlighted the price action around the first zone we spoke about under the daily chart above.
With price having touched and bounced out of the zone already, I'm a little concerned now that we're already back to test it again.
If you're long from the original bounce out of the zone, hold the position.
If you're not long, don't buy the level again. If it does hold and we get a nice intraday bull trend from it, you can always buy the next pullback.

Anyway guys, enjoy what's left of your weekend or look forward to the forex markets opening Monday morning in Asia. Whatever floats your boat haha.
Peace!
Related @forexbrokr CHART ART Blogs
Instagram: @forexbrokr
Website: www.forexbrokr.com