Hello all, here are my technical analysis views on the current BTC market.
Daily chart with a Heikin Ashi candlesticks. There are quite a few bullish signs on the chart starting with the green Heikin Ashi bars, 20 dma crossover of the 50 dma, price is over both 20/50 dma's, embedded stochastics and the price surpassed the previous high of $4979.
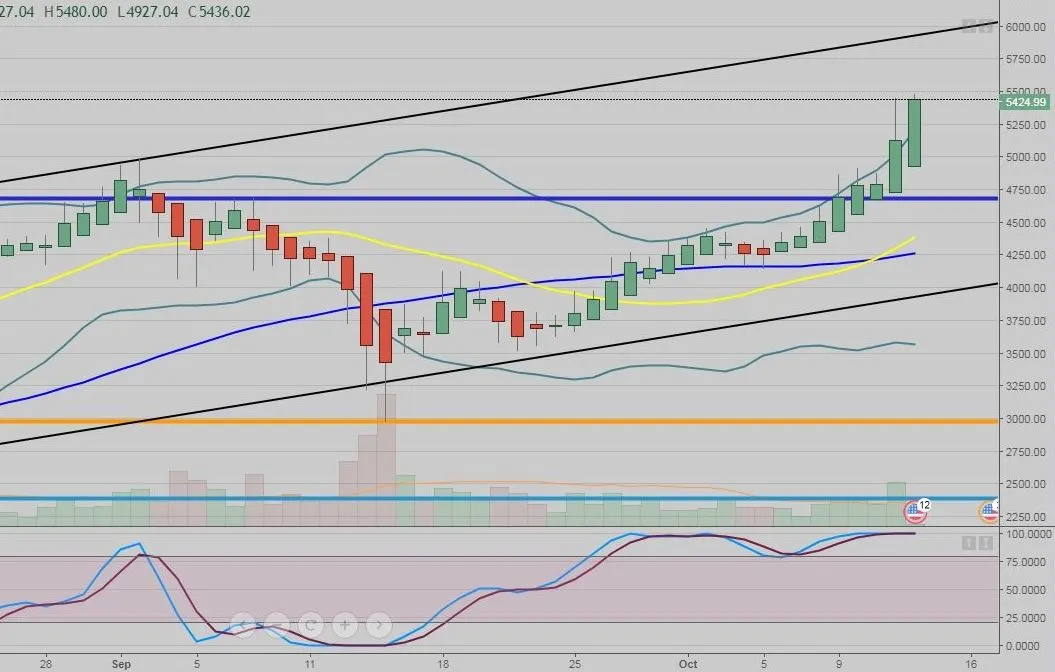
Still a daily chart, but with a better view of the upper and lower trend lines. I speculate that many traders are looking for a potential short term top near the upper trend line within a week or so...(?) That would be right around the $6k level.
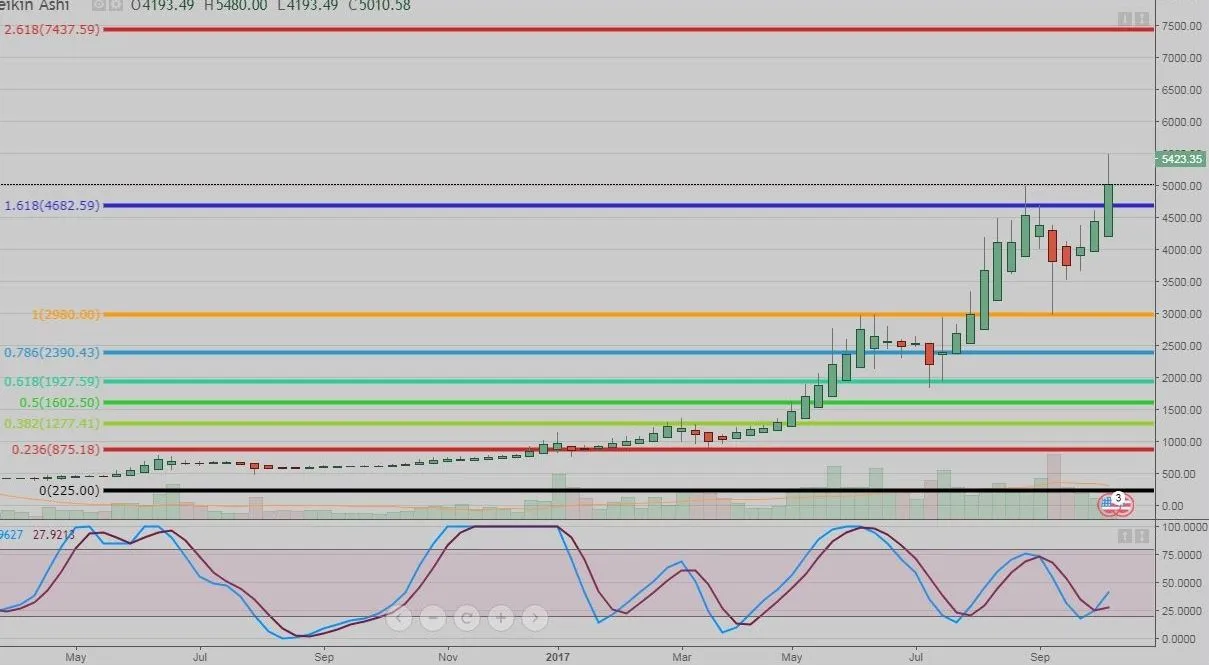
Here is a weekly view with a fibonacci low set at $225 (Going back to 2015) to a high set at the June high at $2967. This projected a 1.618 fib level of $4682 which it surpassed.
The next potential projected level of 2.618 is at $7437. Quite a pie in the sky projection, but the way the world is accepting blockchain technology, this may be attainable next year......???
With many of the 'alt' tokens in a slow selloff, it looks fairly apparent that investors/speculators are placing the proceeds into BTC. With Segwit2x looming in mid Nov, investors are interested in obtaining the Bitcoin Gold token.
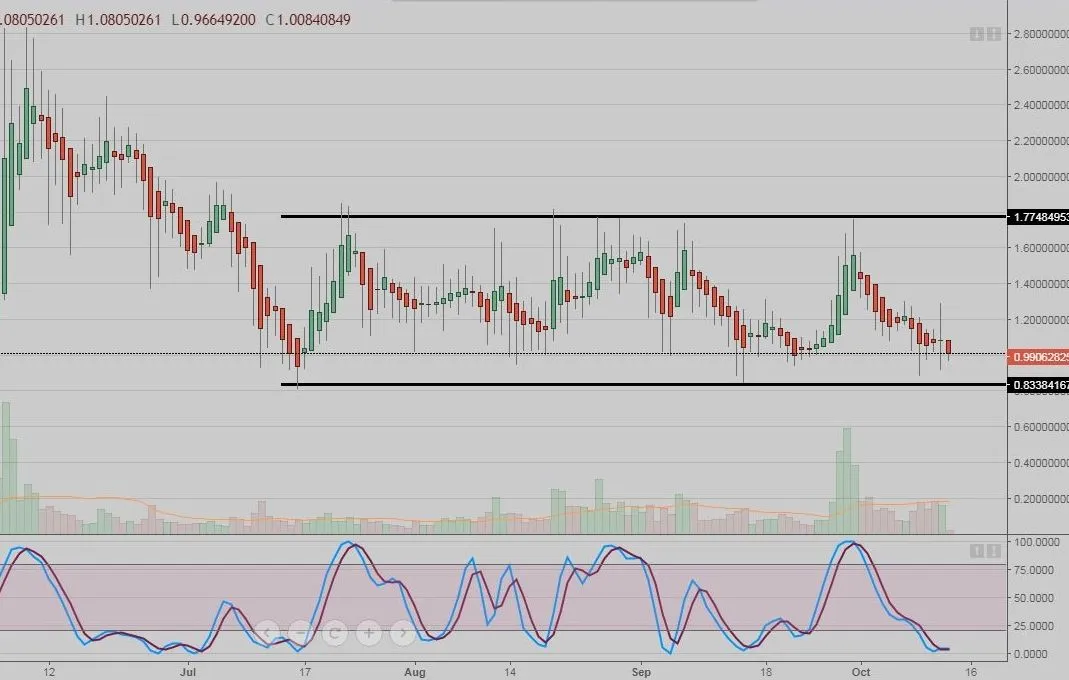
Lastly, here is a daily chart of Steem. It is apparent that Steem it caught in a trading range and will eventually break out, one way or another. I would speculate that the breakout will be to the upside.......whenever that is.
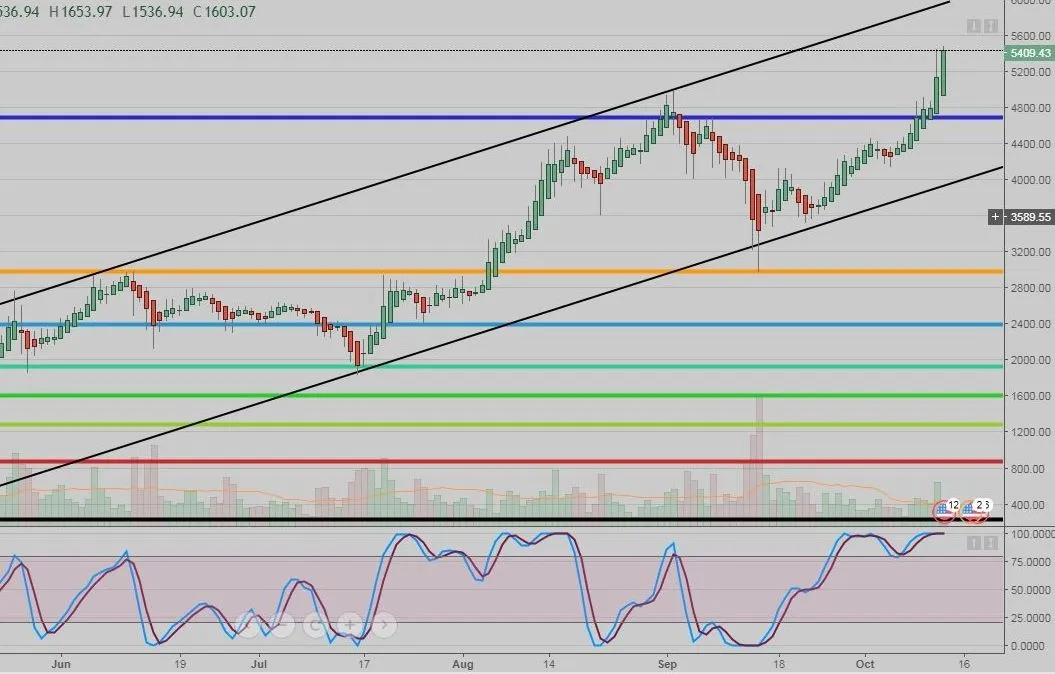
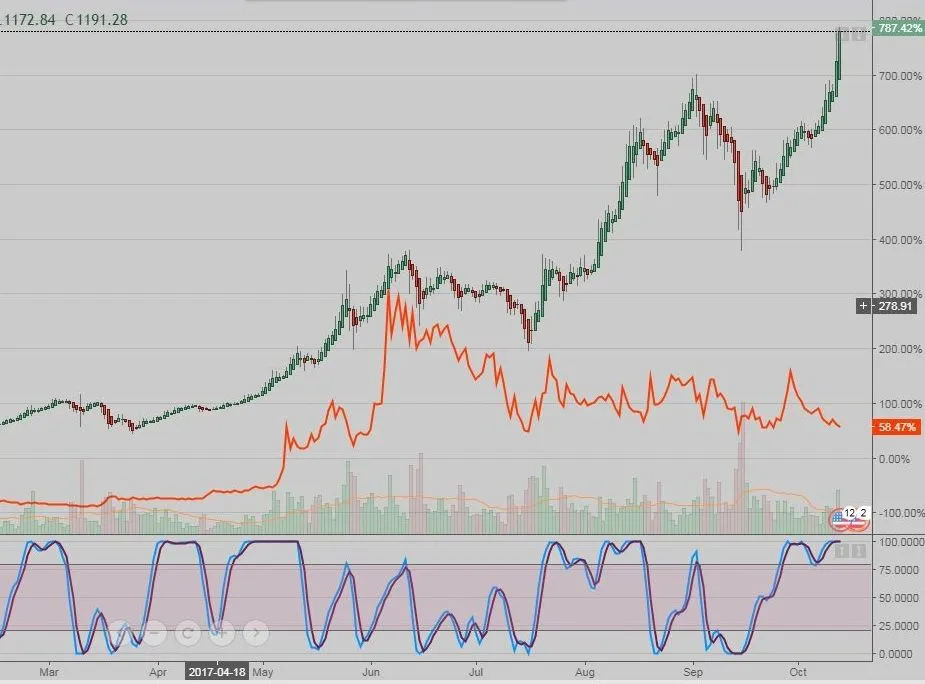
Here is a daily chart of BTC and Steem in red. There has not been much correlation since last July...
Happy Thursday!
