Trace Mayer was an early investor with Bitcoin as he initially purchased it when it was .25. He is an advocate for BTC and runs various companies and the Bitcoin Knowledge Podcast. (Screenshot above) If you are interested in BTC, blockchain and the technology, you can learn quite a bit from listening in on the back episodes of his podcast.
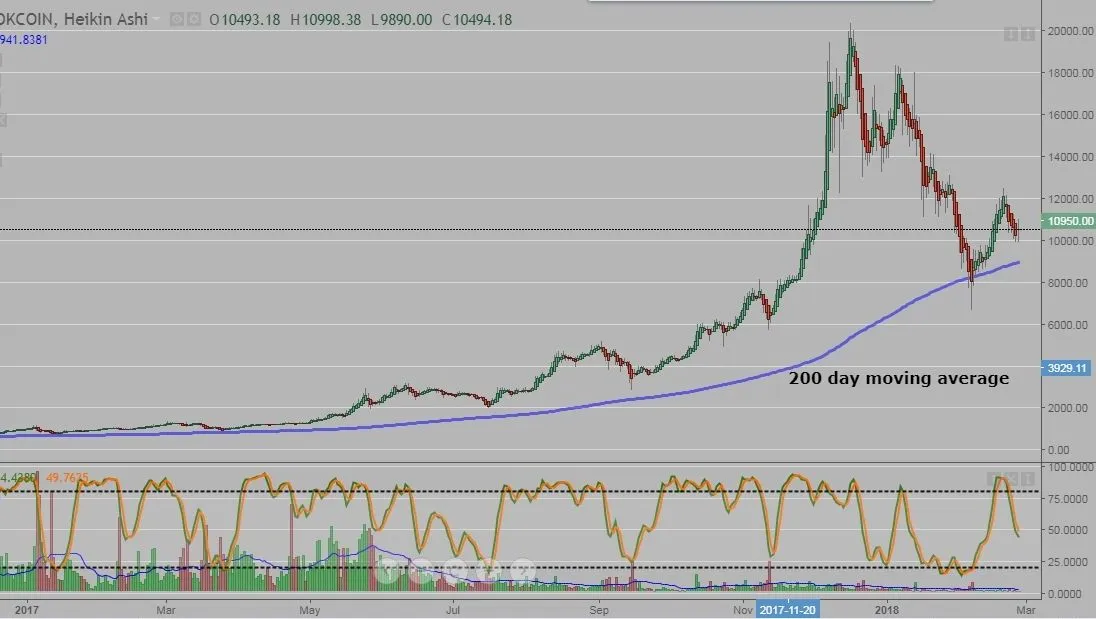
Trace has also made what he calls the Mayer Multiple. This is a ratio between the price and the price of the 200 day moving average. When the multiple is high, it can be seen as overpriced or overbought. When the ratio is low, it can be seen as oversold or underpriced.
The average Mayer Multiple is 1.47. The data can be viewed on 'The Investors Podcast' website. Below is a daily chart of BTC for 2017 with the 200 dma. You can see at the start of the year, the price was floating just above.
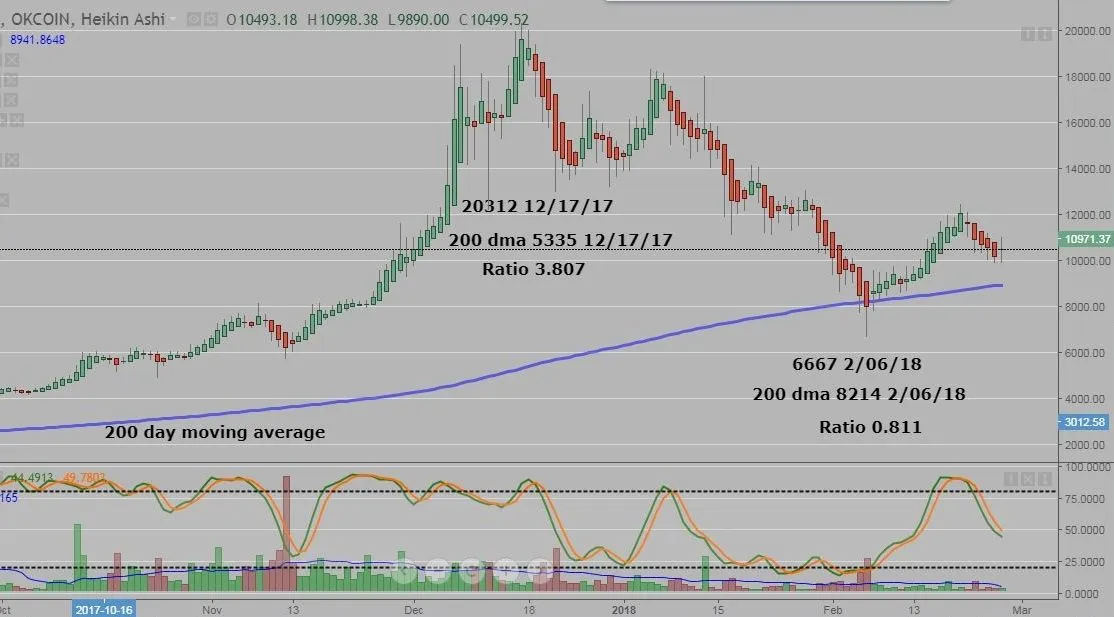
Here is a closer look at the previous high in Dec 17 and the last break low in Feb 18. I listed the price, date, 200 dma price and the ratio. In hindsight, purchasing BTC on 2/6/18 when the ratio was 0.811 was a good investment.
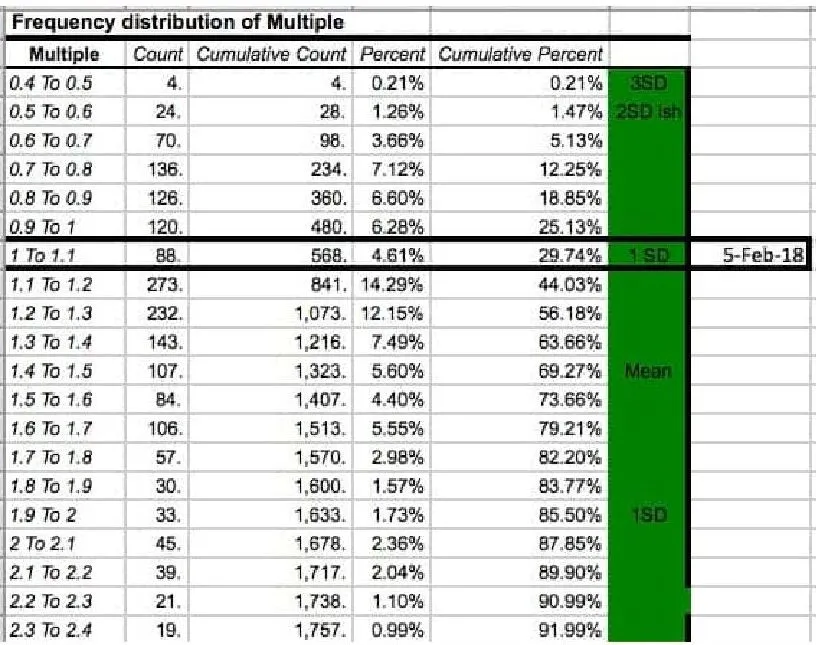
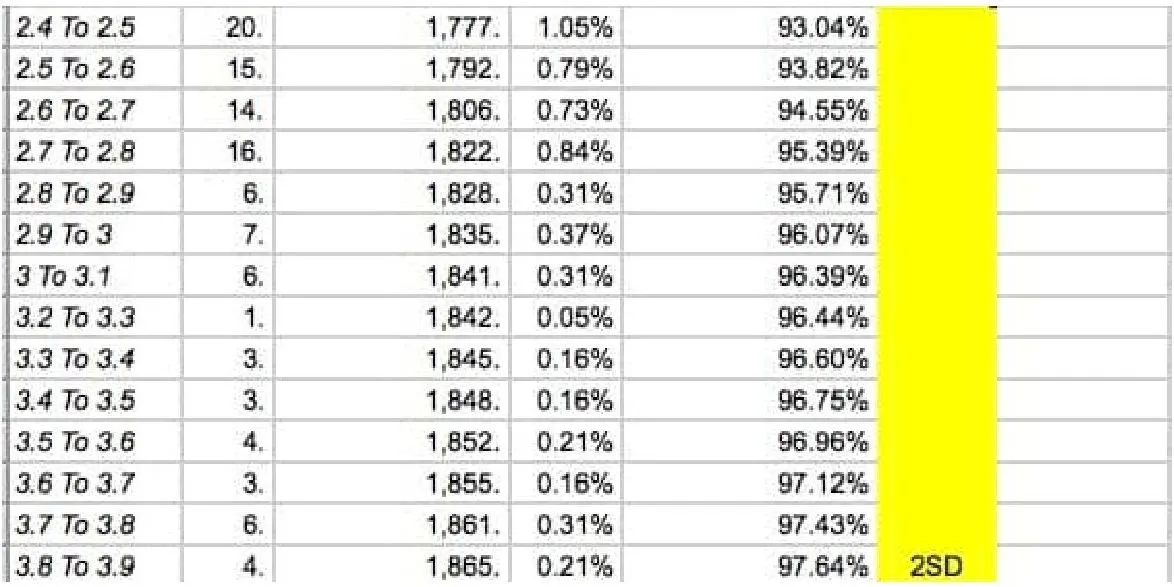
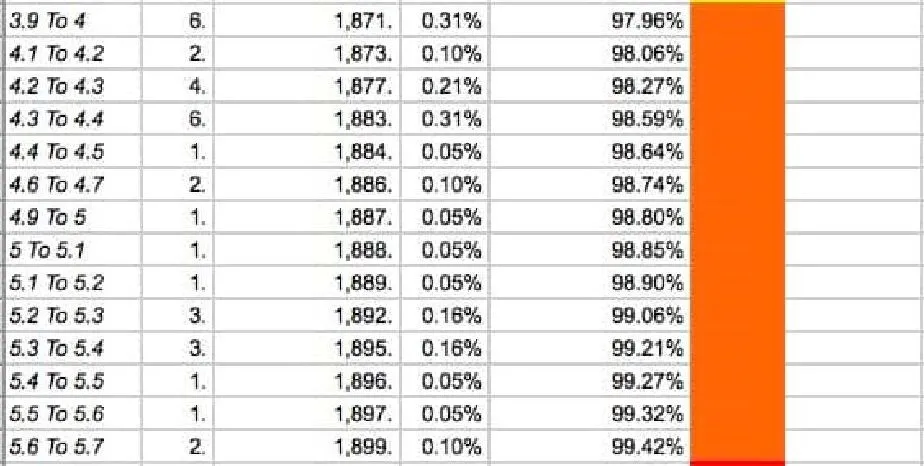
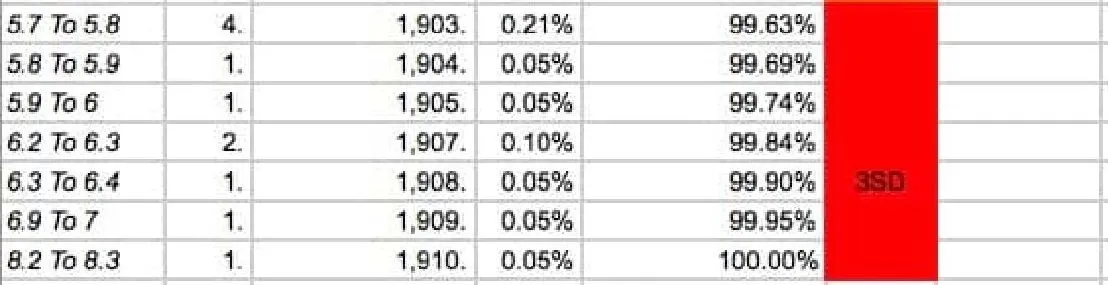
Some of the data collected over the years regarding the multiple. I'm assuming Green is the buy (if your long) and red/orange is the sell warning if your a trader. (I took individual screen shots as the excel spreadsheet was too small to read)
The Investors Podcast also had some information regarding the relationship between BTC and Metcalfe's law. (It basically states that the value of the asset grows as the user base grows. It was intentionally for networking, but has transferred to the internet and social media sites like FB.

When the initial telephone was introduced, it was not long before entire countries adopted the technology. How many people on the plant use a phone now?

This is a chart of BTC following Metcalfe's law. As more users adopt and purchase the coin, the value will exponentially increase.
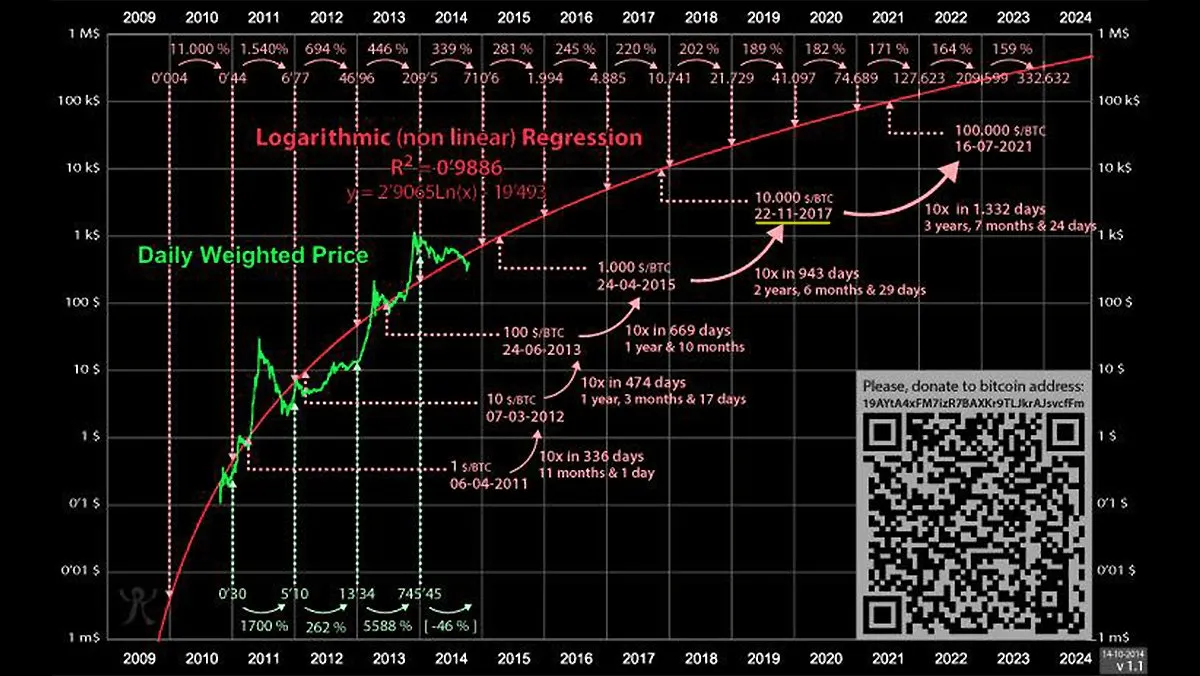
I'm not sure if BTC will follow Metcafe's law 100%, but I'm fairly certain that it will be higher over the next few years.