SUMMARY
To ALL Downvoters, here is an example of how my blog HELPS and does NO HARM!!
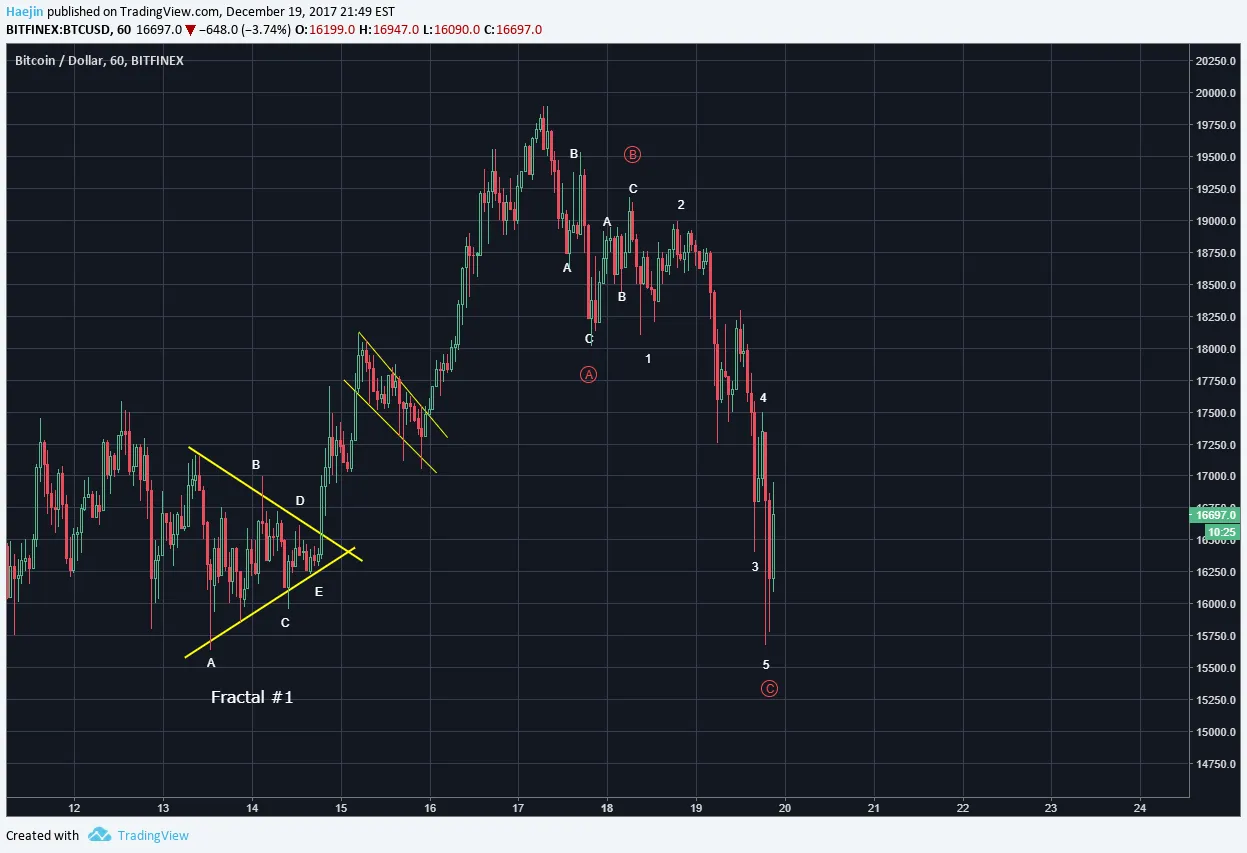
This morning, I had used the below chart to demonstrate an alternate probable pathway and Bitcoin (BTC) decided to take that route!

The a,b,c is classic and vintage Regular Flat (3,3,5) correction. As shown below, the C wave is extending and I've laid out the subwaves for each. If wave C's five subwaves are correct, then there is confidence that the bottom could be near or already complete.
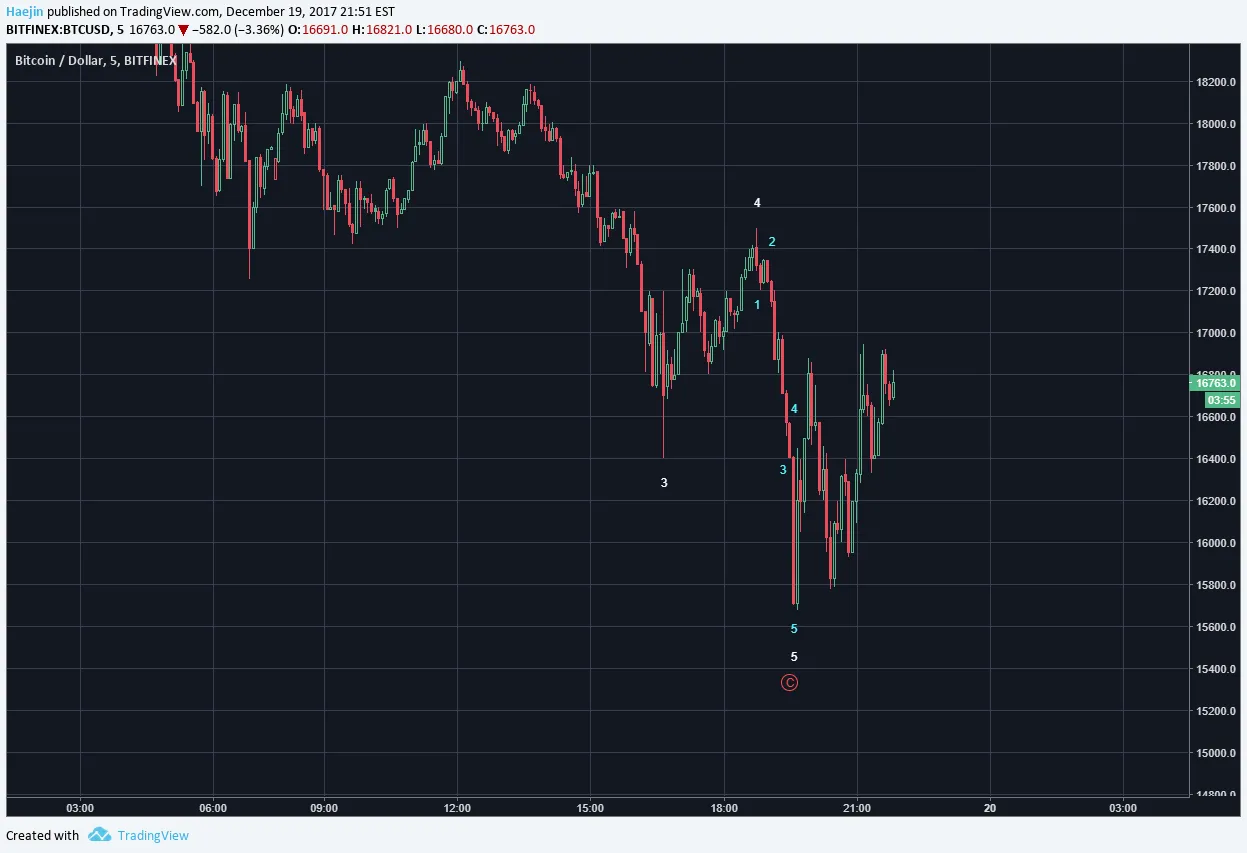
This chart is a high zoom at 5 minute interval and was used to label the subwaves of the subwave 5 of C. This level of subwave labeling adds additional confidence that the bottom could be complete.
There is a scenario for one more lower low as shown below and if so, we could see $15,003 but this is not required. Let's see what happens overnight.

Please consider reviewing these Tutorials on:
Elliott Wave Counting Tutorial #1
Elliott Wave Counting Tutorial #2
Elliott Wave Counting Tutorial #3
Laddering and Buy/Sell Setups.
Laddering Example with EOS
Tutorial on the use of Fibonacci & Elliott Waves
These Technical Analysis Books: Elliott Wave Priniciple & Technical Analysis of Stock Trends are highly recommended
@haejin's Trading Nuggets
Essay: Is Technical Analysis a Quantum Event?
Follow me on Twitter for Real Time Alerts!!
--

If this blog post has entertained or helped you to profit, please follow, upvote, resteem and/or consider buying me a beer:
BTS Wallet - haejin1970
BTC Wallet - 1HMFpq4tC7a2acpjD45hCT4WqPNHXcqpof
ETH Wallet - 0x1Ab87962dD59BBfFe33819772C950F0B38554030
LTC Wallet - LecCNCzkt4vjVq2i3bgYiebmr9GbYo6FQf

Legal Mumbo Jumbo: This is only my opinion, make of it what you wish. What does this mean? It means it's not advice nor recommendation to either buy or sell anything! It's only meant for use as informative or entertainment purposes.**