
SUMMARY
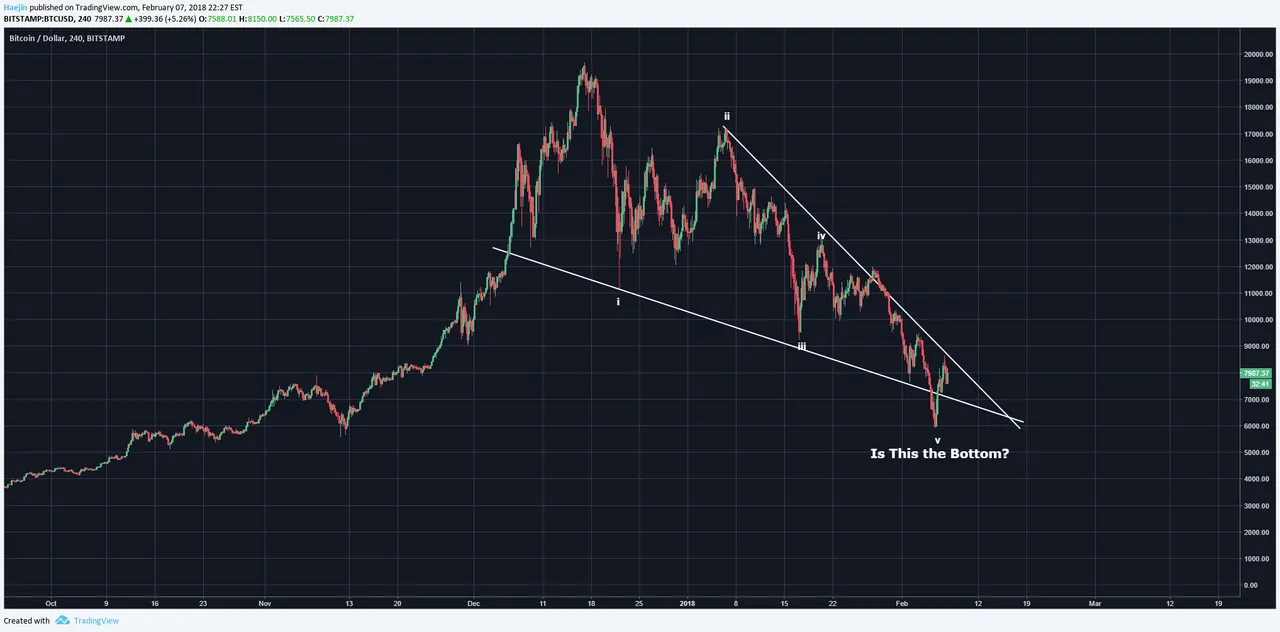
Earlier today, I had indicated a couple breakout targets, depending on the starting point of the breakout. As price has been holding up well throughout the day, the below wedge pattern is now very close to having the upper line breached. So, does the bull wick indicate the bottom?
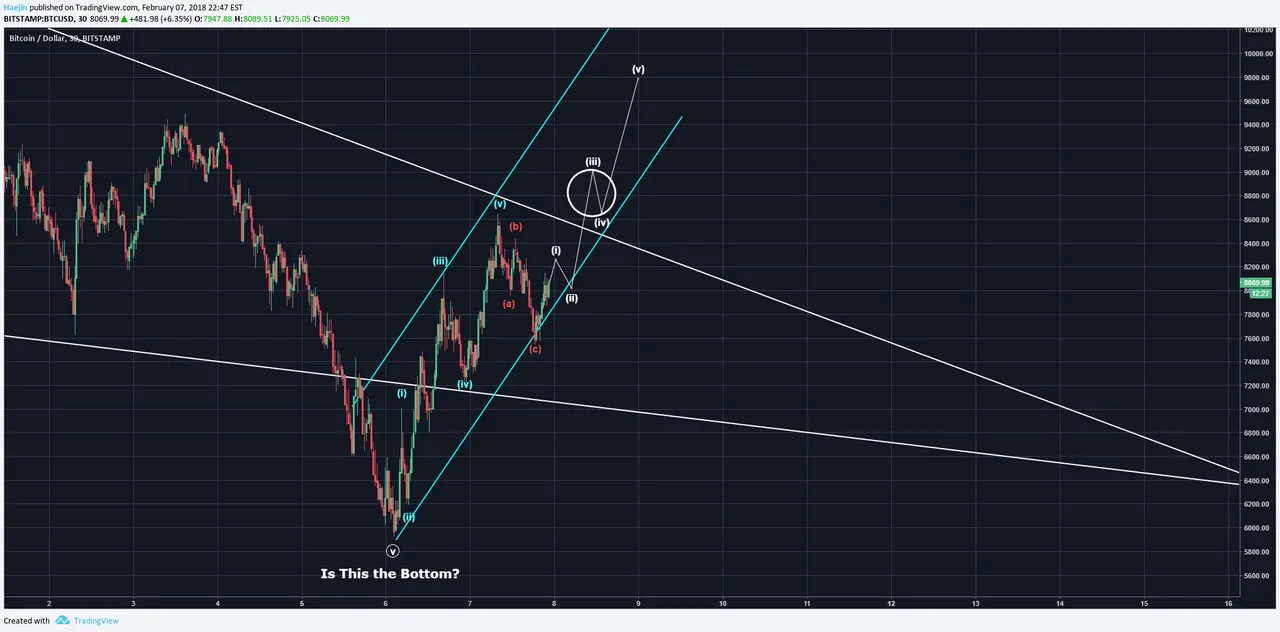
Thus far, price has been moving well within an early channel formation (blue parallel lines). This is often indicative of an impulse that can be sustained. In this morning's update, it was written that I often look for three impulse rounds. The first has already been placed (blue i,ii,iii,iv,v) followed by the requisite correction (red abc). We have likely started the second impulse round (white i,ii,iii,iv,v). Overnight, this round has a very strong chance to breach the upper white line and if so....then yes, the bull wick could mark the bottom! The breach MUST be DECISIVE and not a fake out where promptly falls back into the wedge. If the decisive breakout occurs, a buy ladder is cast in the region of the white circle.
Legal Disclaimer: This is only my opinion, make of it what you wish. What does this mean? It means it's not advice nor recommendation to either buy or sell anything! It's only meant for use as informative or entertainment purposes.
Please consider reviewing these Tutorials on:
Elliott Wave Counting Tutorial #1
Elliott Wave Counting Tutorial #2
Elliott Wave Counting Tutorial #3
Laddering and Buy/Sell Setups.
Laddering Example with EOS
Tutorial on the use of Fibonacci & Elliott Waves
@haejin's Trading Nuggets
Essay: Is Technical Analysis a Quantum Event?
Follow me on Twitter for Real Time Alerts!!
Follow me on StockTwits for UpDates!!
--
--

If this blog post has entertained or helped you to profit, please follow, upvote, resteem and/or consider buying me a beer:
BTC Wallet - 1HMFpq4tC7a2acpjD45hCT4WqPNHXcqpof
ETH Wallet - 0x1Ab87962dD59BBfFe33819772C950F0B38554030
LTC Wallet - LecCNCzkt4vjVq2i3bgYiebmr9GbYo6FQf
