
SUMMARY
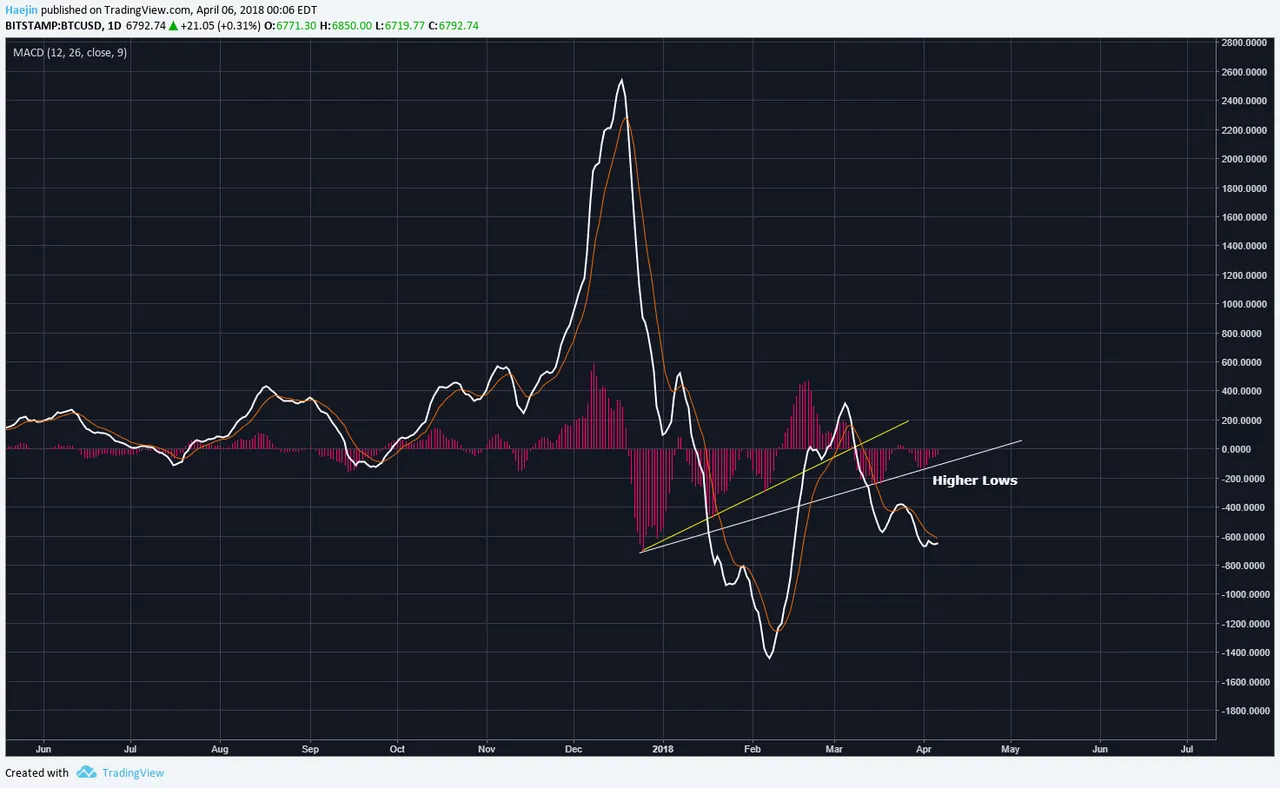
The MACD histogram is an early scout showing how the 12 day (white) and the 26 day (red) lines will move and in which direction. The two layers of higher lows shown by the histogram is uncanny. This means that there is strong probability that the white/red lines will also generate a higher low. That occurrence is my primary count.
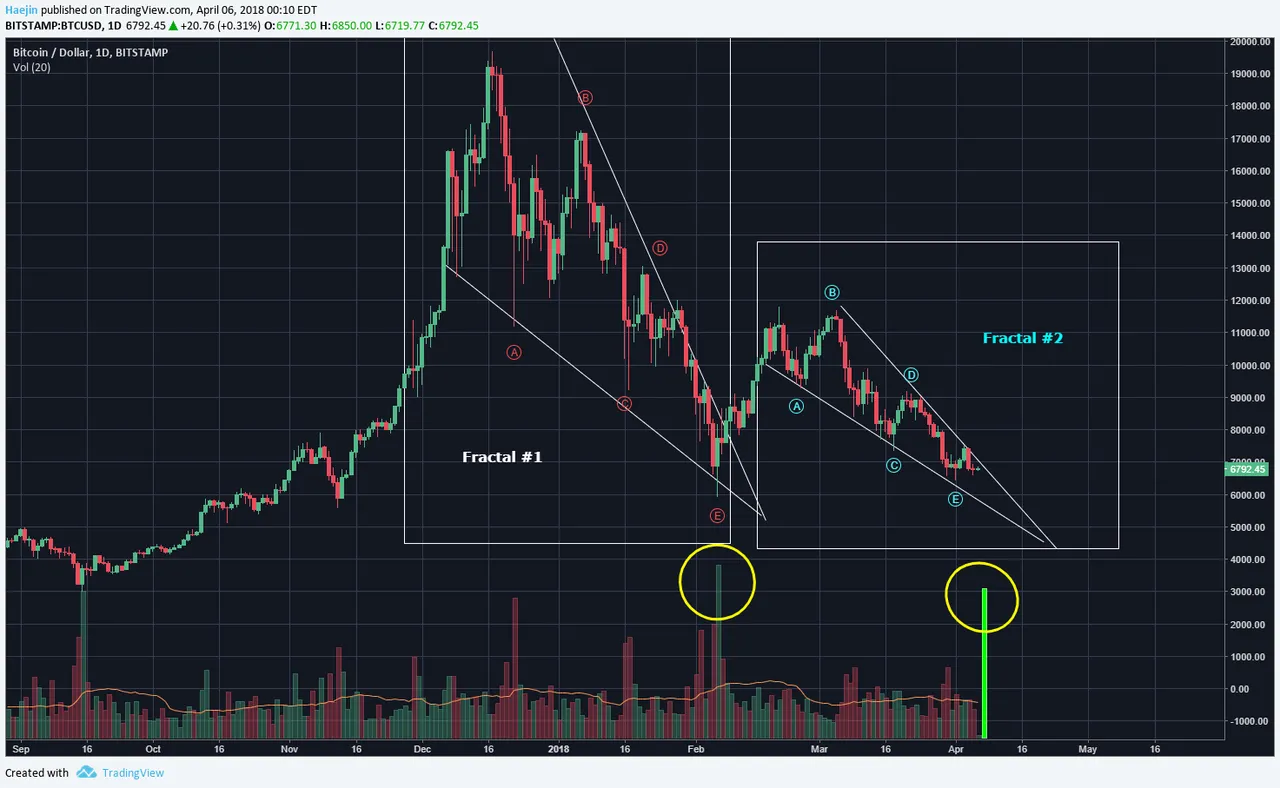
The fractal nature of the current pattern to it's prior brother seems to only differ in size. However, the overall price moves and Elliott Waves are quite similar. Just as a monster volume had moved Bitcoin (BTC) out of the confines of the contracting lines; the second fractal needs the same monster type of volume move (green vertical rectangle). The current fractal also is a bit distant from the apex just as it had been for the first fractal.
Legal Disclaimer: I am not a financial advisor nor is any content in this article presented as financial advice. The information provided in this blog post and any other posts that I make and any accompanying material is for informational purposes only. It should not be considered financial or investment advice of any kind. One should consult with a financial or investment professional to determine what may be best for your individual needs. Plain English: This is only my opinion, make of it what you wish. What does this mean? It means it's not advice nor recommendation to either buy or sell anything! It's only meant for use as informative or entertainment purposes.
Please consider reviewing these Tutorials on:
Elliott Wave Counting Tutorial #1
Elliott Wave Counting Tutorial #2
Elliott Wave Counting Tutorial #3
Laddering and Buy/Sell Setups.
Laddering Example with EOS
Tutorial on the use of Fibonacci & Elliott Waves
@haejin's Trading Nuggets
Essay: Is Technical Analysis a Quantum Event?
Follow me on Twitter for Real Time Alerts!!
Follow me on StockTwits for UpDates!!
--
--

