
SUMMARY
First, I strongly urge a complete viewing of the video analysis as it contains a fuller scope and details of my rationale and chart pattern discussions. In this video, I introduce early thoughts on why and how Bitcoin (BTC) could hit $3.6 Mil or higher! I'm quite sane of mind and have an analysis that I believe goes against the herd of analysts calling for the top and crash day after day.
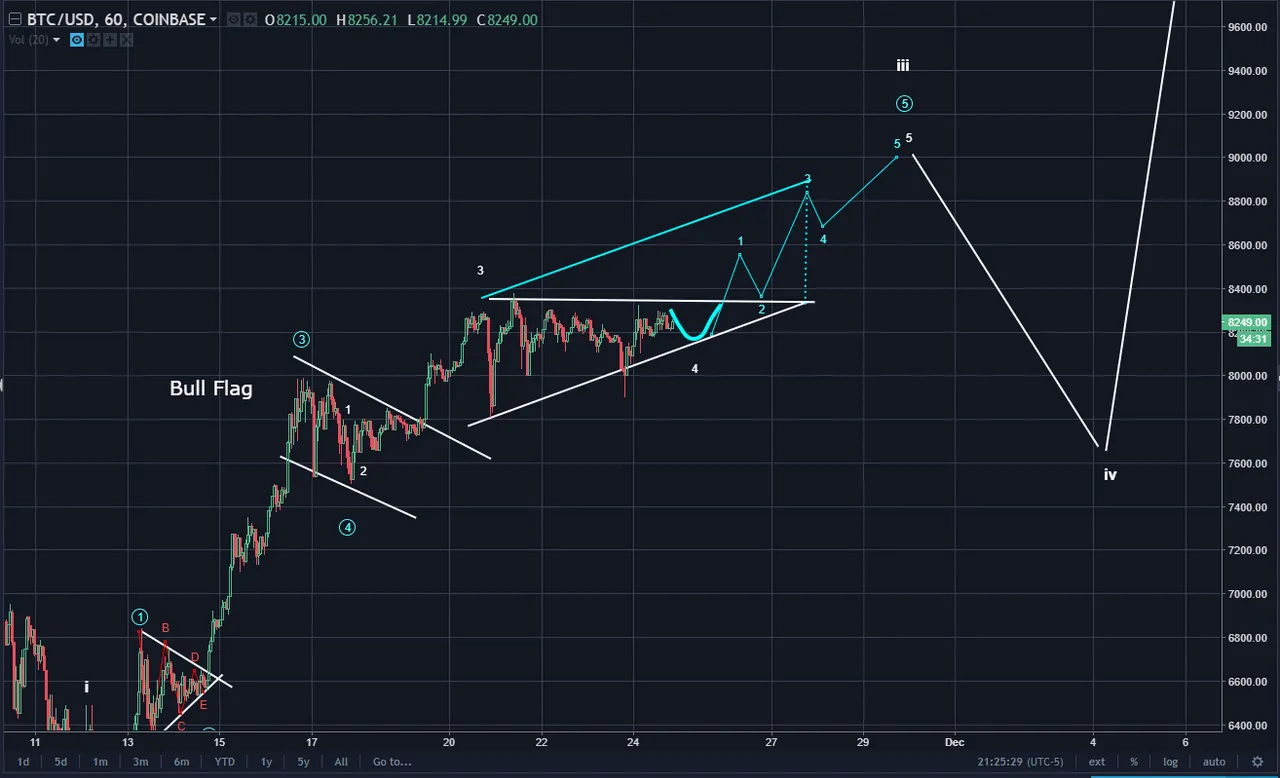
Second: The short term count is boring compared to the analysis on how Bitcoin can hit $3.6 Mil. But, still, there is evidence of an ascending right triangle pattern. Since the price had been meandering laterally now for a few days, there are many traits of a consolidation which is expected to complete soon.
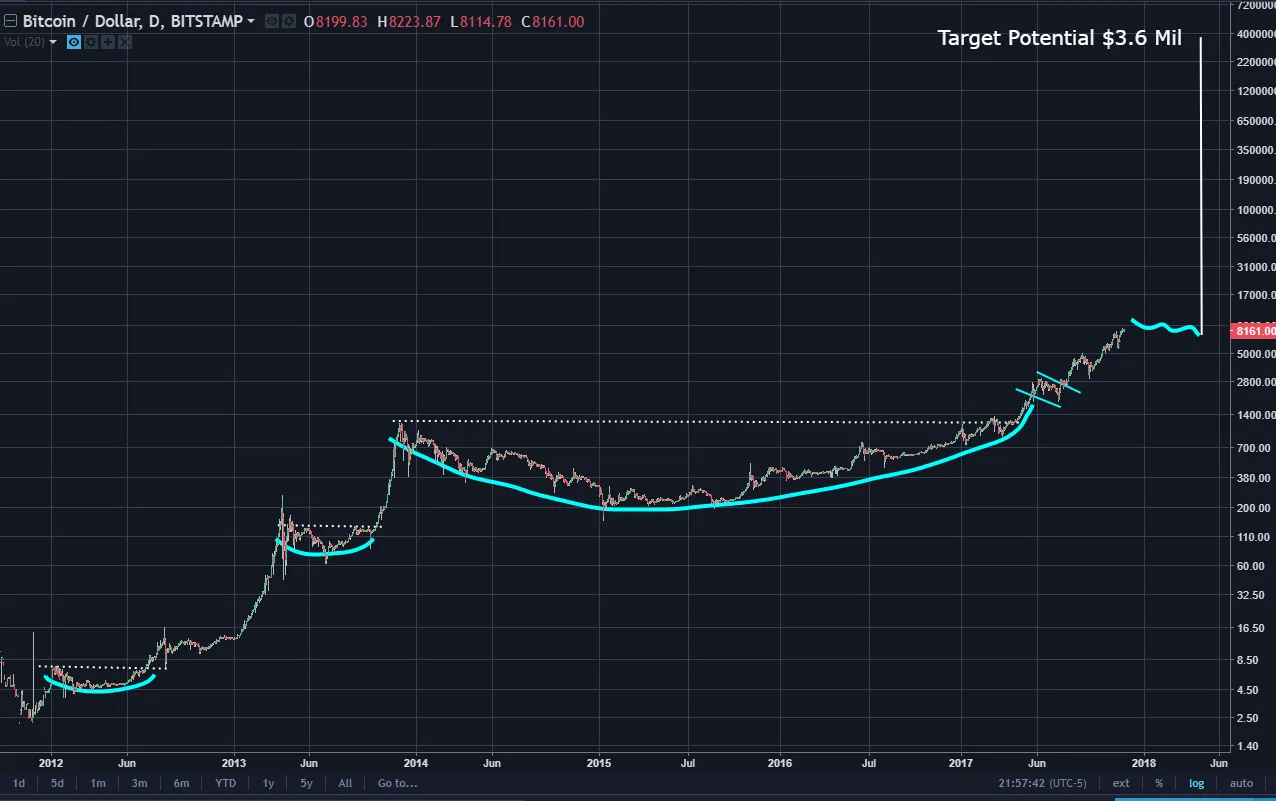
Below is a log chart of Bitcoin and I see three fractals. The first two fractals are complete and the third just escaped the rounding launch pad pattern (blue saucer line). Note how the left two small rounding bottoms were used as launch pads to go vertical. These price moves were phenomenal. Now note the much larger, about 8x that of the smaller fractals. If this too is to be used as a launch pad for the next vertical move....it will be a sight to behold! If BTC tags $10k or so and then does a minor correction (squigly blue line) the vertical phase, if proportional to the earlier fractals, could cause BTC to reach $3.6 Mil. Or, HIGHER! (The video is longer than usual because it has tons more details you'll want to hear and see!)
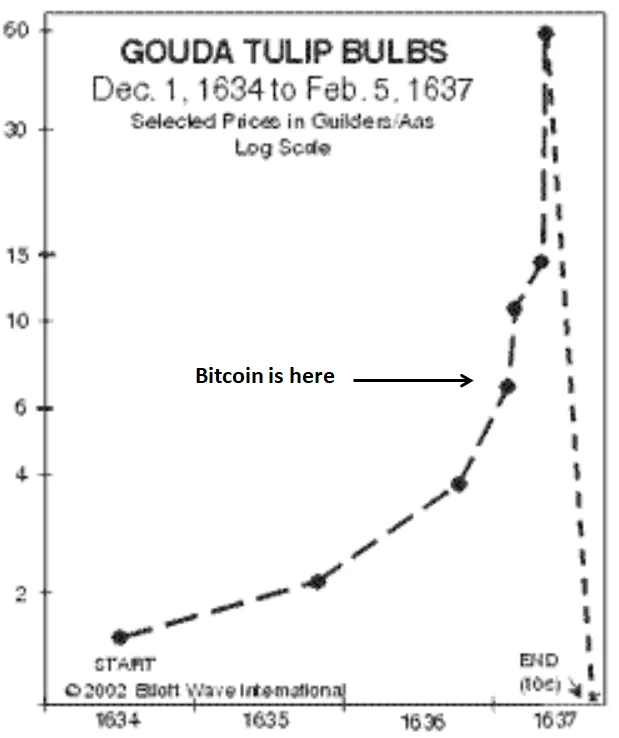
The below is the chart of the Tulip Mania. I've marked where Bitcoin might be in equivalent life stage. If so, BTC's upcoming vertical move will be unbelievable. There will be major corrections along the way but the vertical move will be almost impossible to not notice. Note that the time band is completely unknown nor projected. The poorest forecast area of my algorith is timing. Still, the direction and size of move, if accurately projected can lead to MASSIVE profits in the abscence of equally accurate time bands.
Please consider reviewing these Tutorials on:
Elliott Wave Counting Tutorial #1
Elliott Wave Counting Tutorial #2
Elliott Wave Counting Tutorial #3
Laddering and Buy/Sell Setups.
Laddering Example with EOS
Tutorial on the use of Fibonacci & Elliott Waves
These Technical Analysis Books: Elliott Wave Priniciple & Technical Analysis of Stock Trends are highly recommended
Follow me on Twitter for Real Time Alerts!!
--
--

If this blog post has entertained or helped you to profit, please follow, upvote, resteem and/or consider buying me a beer:
BTS Wallet - haejin1970
BTC Wallet - 1HMFpq4tC7a2acpjD45hCT4WqPNHXcqpof
ETH Wallet - 0x1Ab87962dD59BBfFe33819772C950F0B38554030
LTC Wallet - LecCNCzkt4vjVq2i3bgYiebmr9GbYo6FQf

Legal Mumbo Jumbo: This is only my opinion, make of it what you wish. What does this mean? It means it's not advice nor recommendation to either buy or sell anything! It's only meant for use as informative or entertainment purposes.**