
SUMMARY
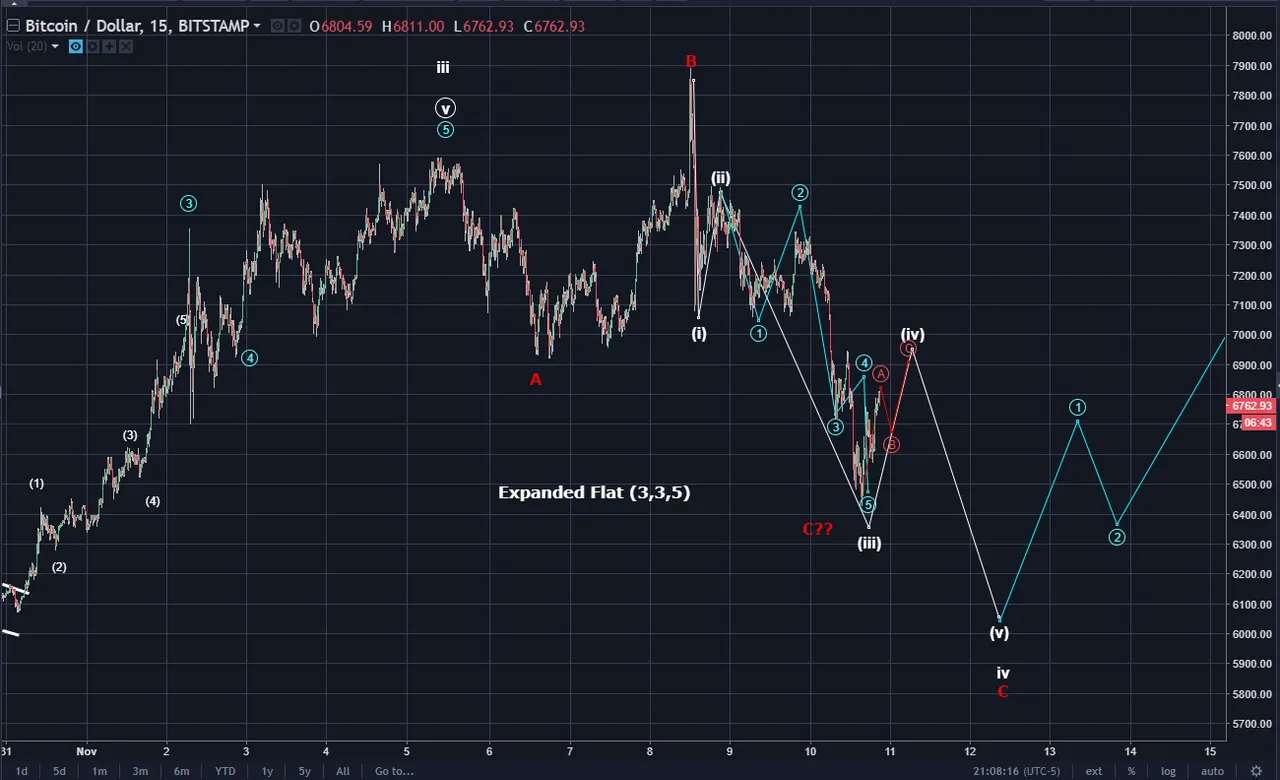
It's quite good to see price adhere so closely to the wave lines I had drawn. The chart below shows that the blue colored five waves down are complete. The current bounce looks three wave like and is expected to put in the white wave iv. The red C?? marks a potential bottom, especially if price start impulsing and put in five waves up. The recent low is also a respectable degree lower than the low of red wave A. So, the key is if there will be an impulse set of waves up. The video analysis reviews the details of this potential scenario better than what can be summarized here.
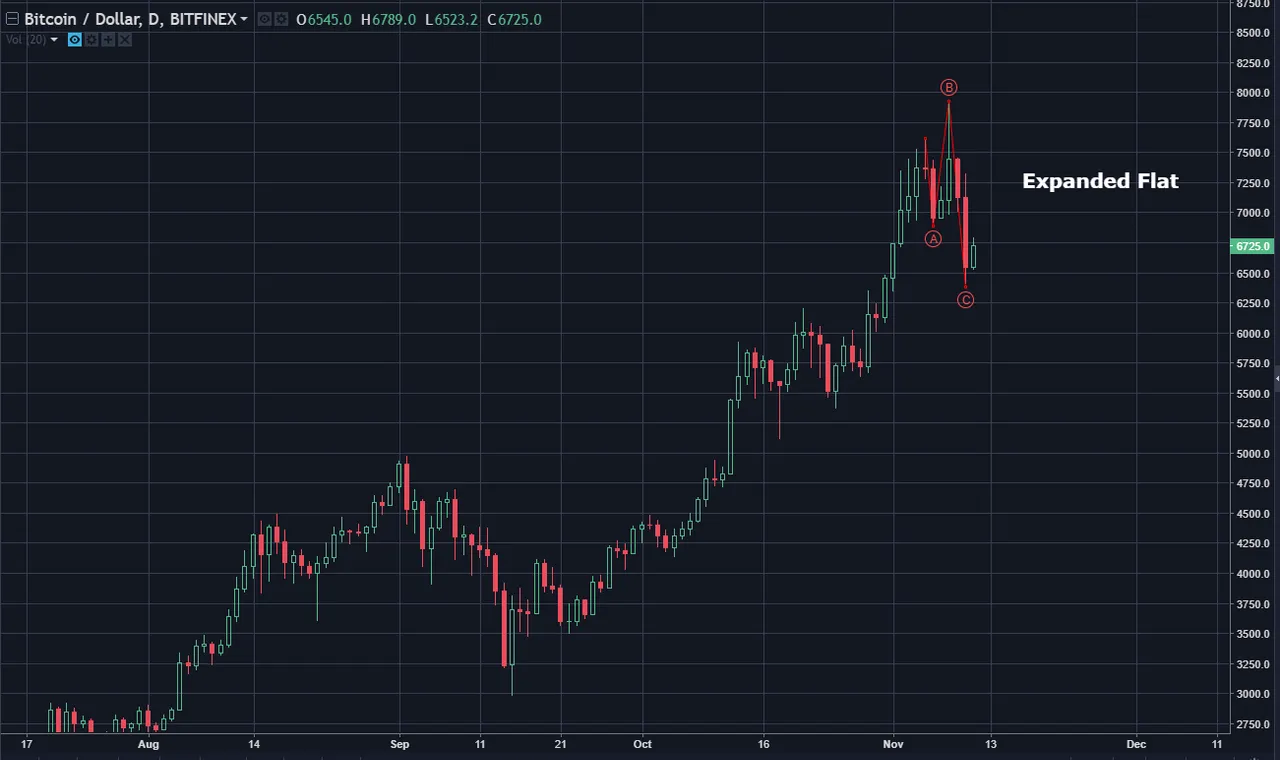
The daily chart perspective shows that if the recent low was the bottom, it fits well into form of an expanded flat. Declining to $6,100 or so would have the red c wave of the expanded flat a bit too low.
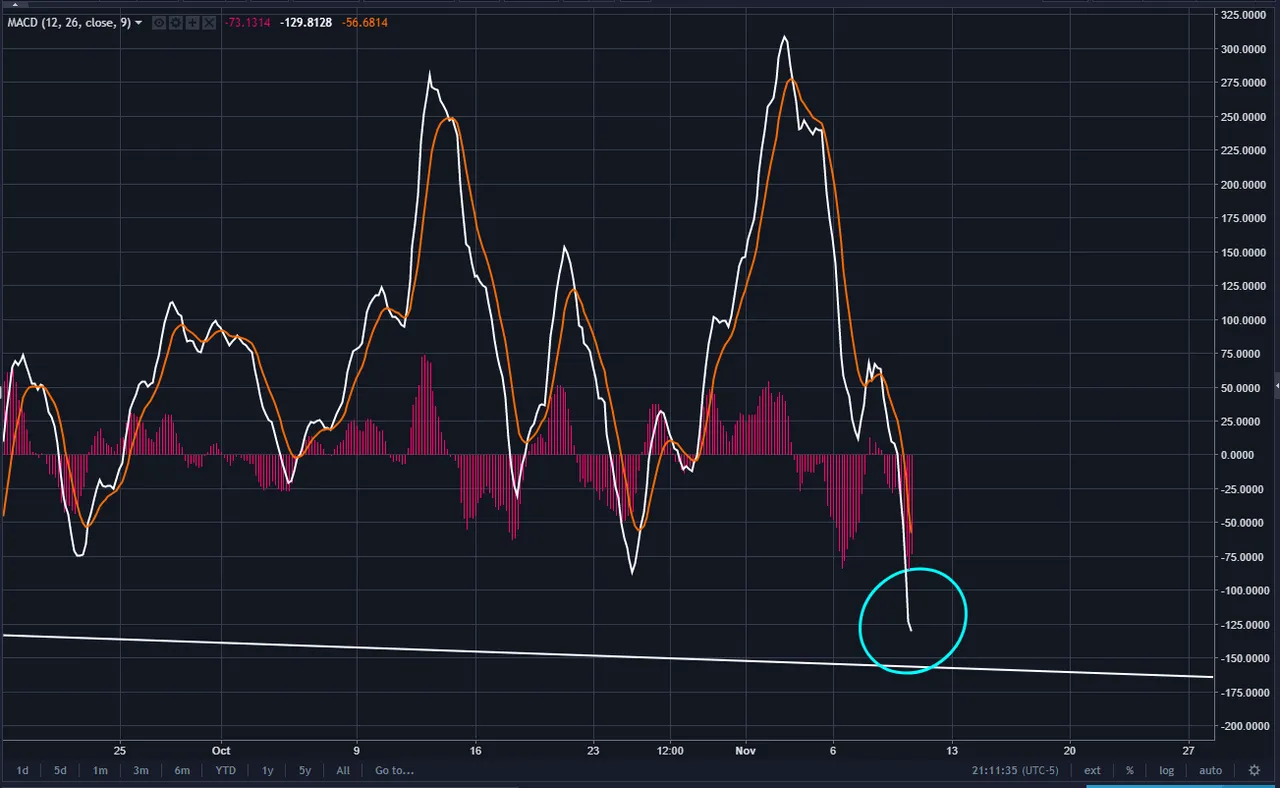
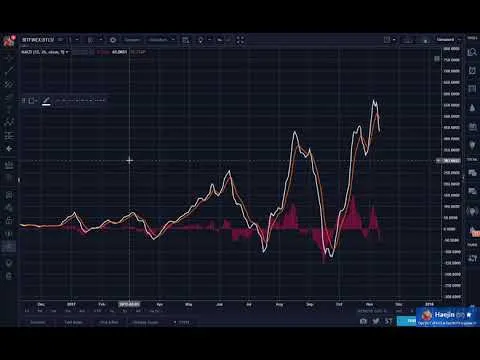
The 4 hour MACD charts shows a deeply oversold condition. This also adds credence to a potential bottom as the bounce should be no insignificant.
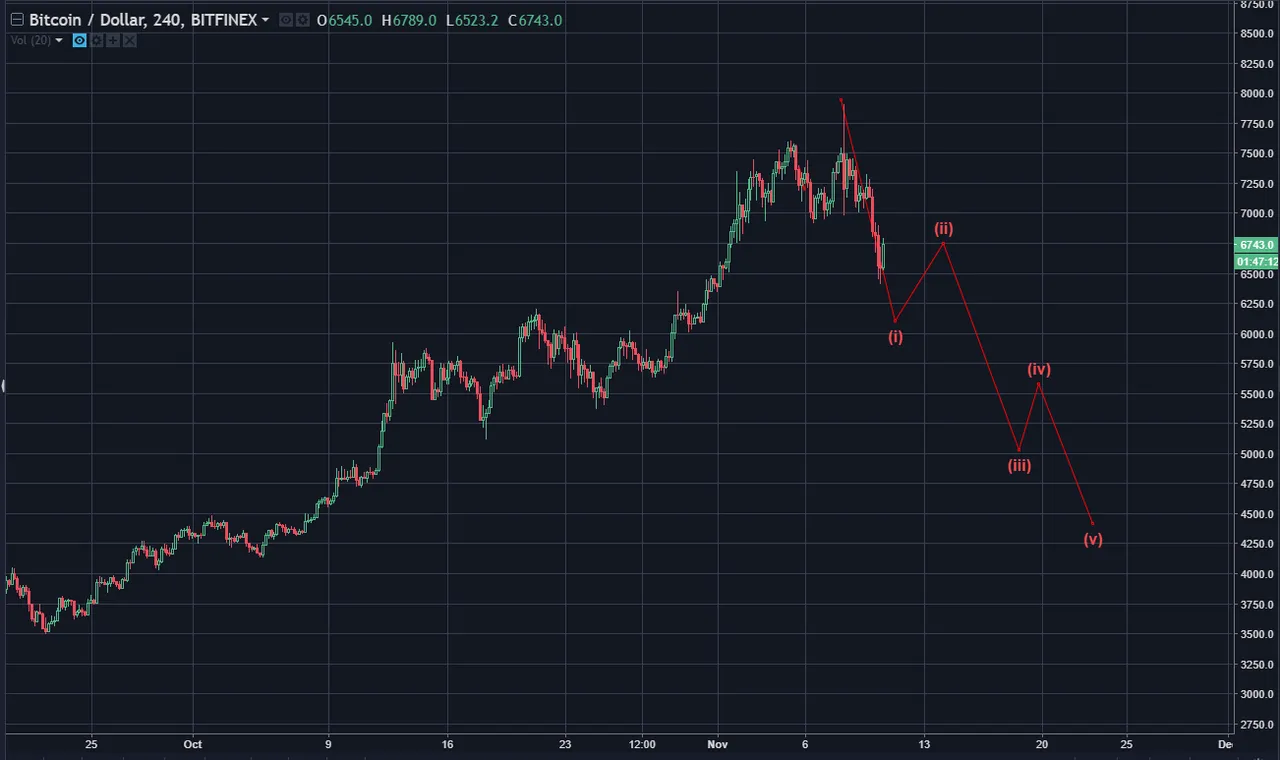
The most bearish case is if an impulse downard is completed. Though, I'm only adding this scenario so as to put in on the table of possibility and not yet probability.
Please consider reviewing these Tutorials on:
Elliott Wave Counting Tutorial
Laddering and Buy/Sell Setups.
Tutorial on the use of Fibonacci & Elliott Waves
These Technical Analysis Books: Elliott Wave Priniciple & Technical Analysis of Stock Trends are highly recommended
--
--

If this blog post has entertained or helped you to profit, please follow, upvote, resteem and/or consider buying me a beer:
BTS Wallet - d2e60e9856c36f34
BTC Wallet - 15ugC4U4k3qsxEXT5YF7ukz3pjtnw2im8B
ETH Wallet - 0x1Ab87962dD59BBfFe33819772C950F0B38554030
LTC Wallet - LefeWrQXumis3MzrsvxHWzpNBAAFDQbB66

Legal Mumbo Jumbo: This is only my opinion, make of it what you wish. What does this mean? It means it's not advice nor recommendation to either buy or sell anything! It's only meant for use as informative or entertainment purposes.**