
SUMMARY
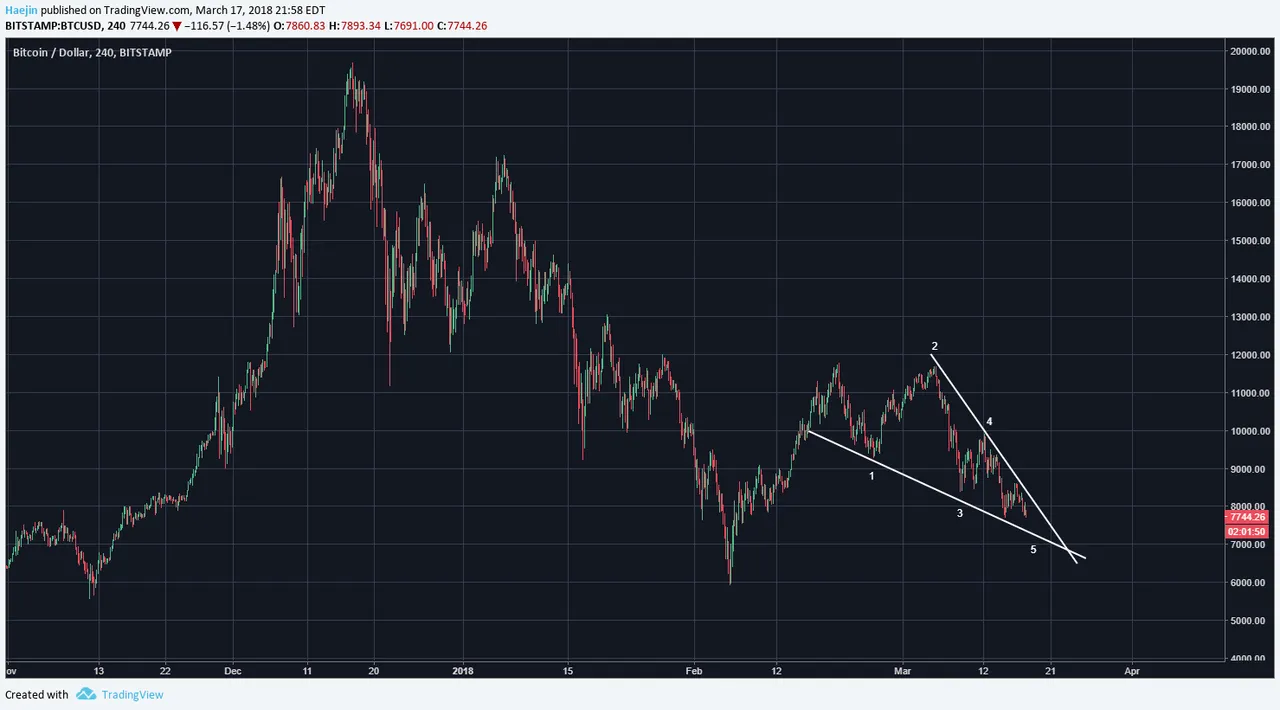
As of this writing, we are at about $7,610 and as the chart shows below, the decline towards wave 5 is well in progress. This wedge pattern is expected to play out and the fractal that was introduced in detail during today's mid-day update calls for a bull wick spike down. We could potentially see a reange of $7,500 to $6,900 or so.
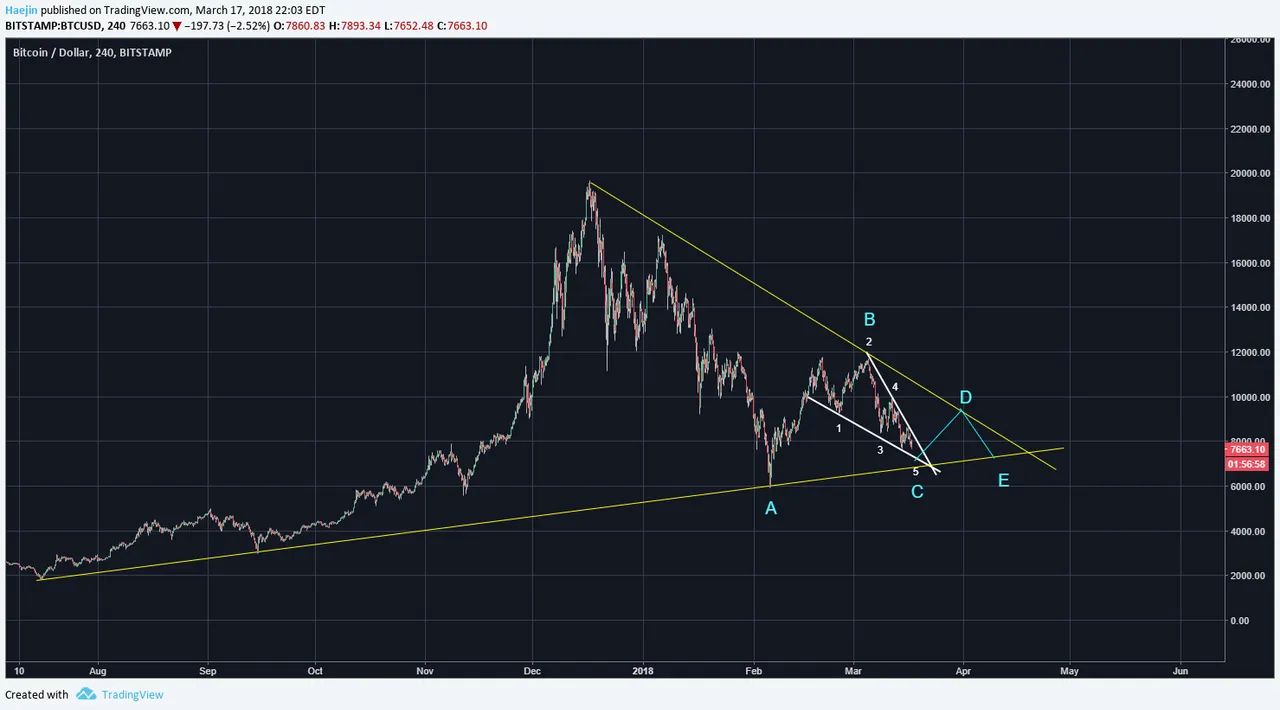
The critical juncture shows that the blue C is currently in progress and the lower white line support has been a strong one for quite a while and should hold and allow for blue wave D to take place and then E. The criticality of the support holding can't be overstated. Let's see how the overnight price action plays out! Exciting times are ahead of us all!
Legal Disclaimer: I am not a financial advisor nor is any content in this article presented as financial advice. The information provided in this blog post and any other posts that I make and any accompanying material is for informational purposes only. It should not be considered financial or investment advice of any kind. One should consult with a financial or investment professional to determine what may be best for your individual needs. Plain English: This is only my opinion, make of it what you wish. What does this mean? It means it's not advice nor recommendation to either buy or sell anything! It's only meant for use as informative or entertainment purposes.
Please consider reviewing these Tutorials on:
Elliott Wave Counting Tutorial #1
Elliott Wave Counting Tutorial #2
Elliott Wave Counting Tutorial #3
Laddering and Buy/Sell Setups.
Laddering Example with EOS
Tutorial on the use of Fibonacci & Elliott Waves
@haejin's Trading Nuggets
Essay: Is Technical Analysis a Quantum Event?
Follow me on Twitter for Real Time Alerts!!
Follow me on StockTwits for UpDates!!
--
--

