
SUMMARY
This post will take the price development analysis from the short term to the bigger picture perspective. Bitcoin (BTC) has been adhereing to the scribbled line drawn per Fibonacci and Elliott Wave levels quite well. Not too shabby! The RS of the IHS pattern is well in progress.
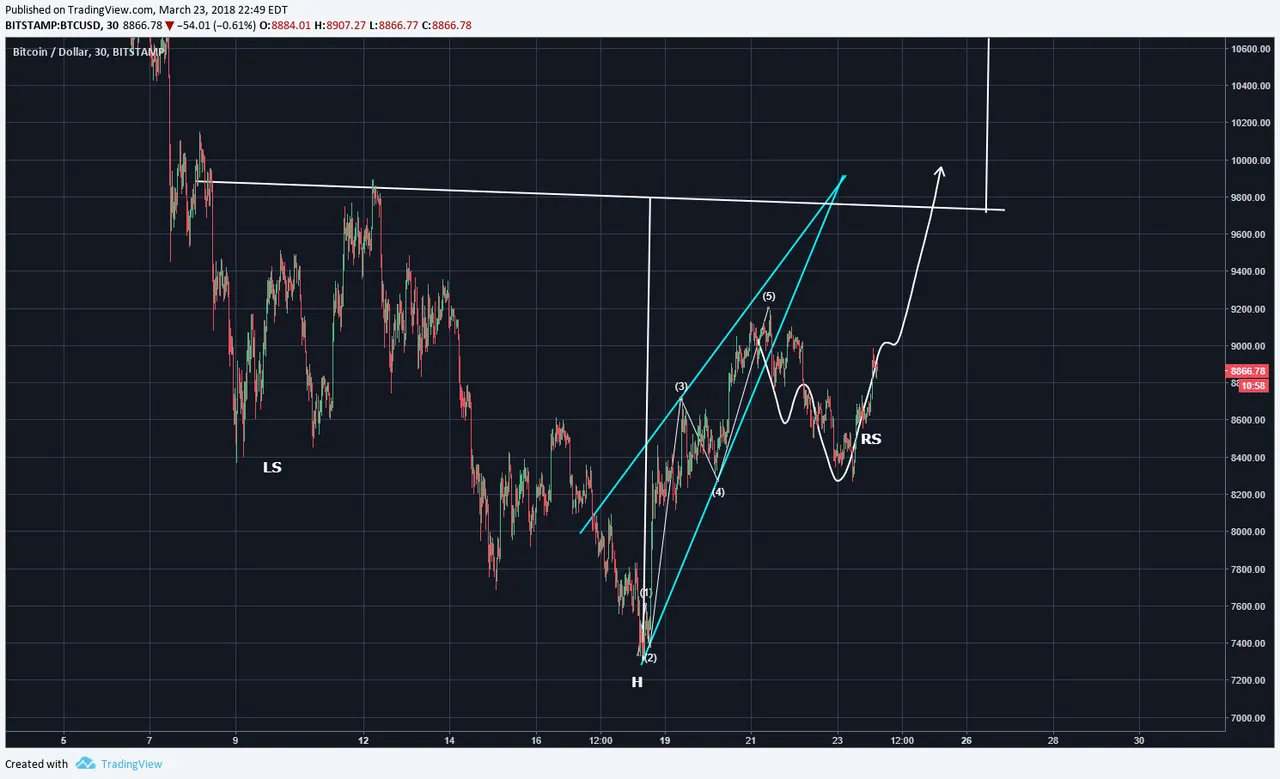
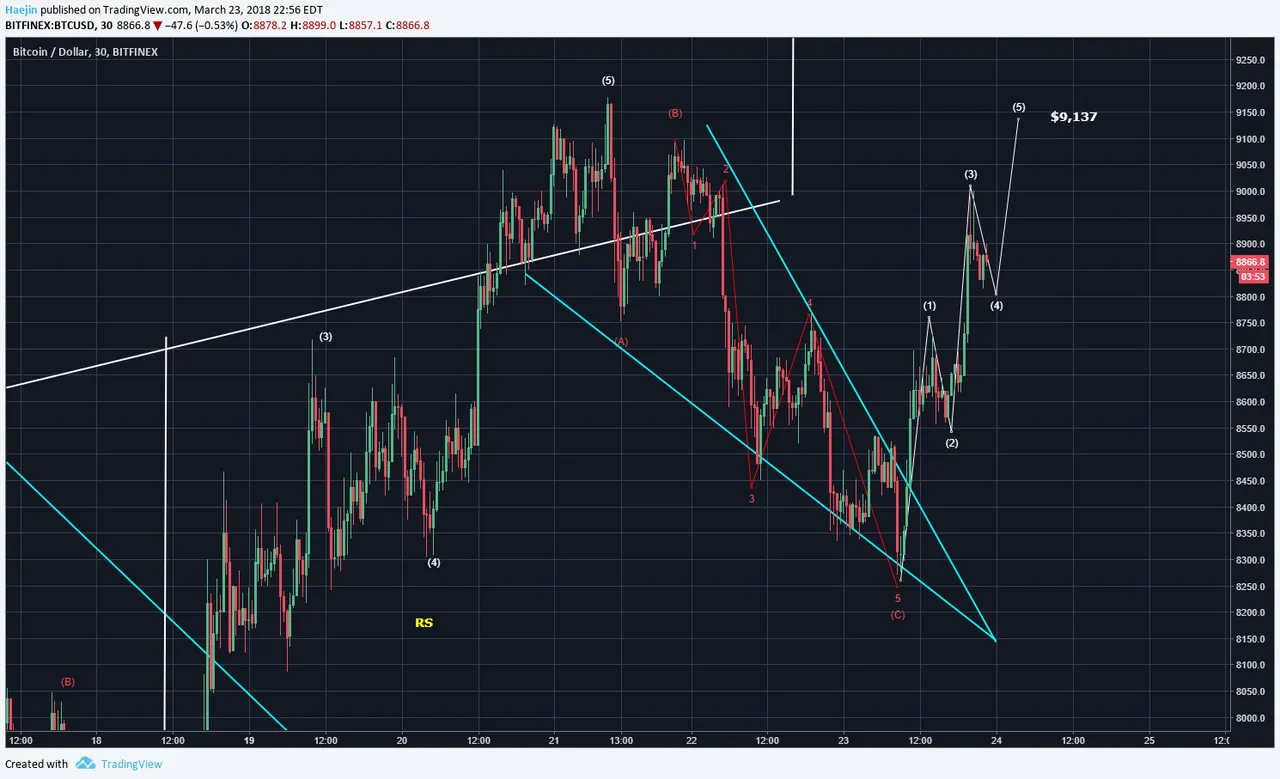
The impulse is well underway and while wave 3 could extend further, the below chart shows that all but wave 5 are completed. IF this count is correct, then wave 5 should hit around $9,137 as a short term target.
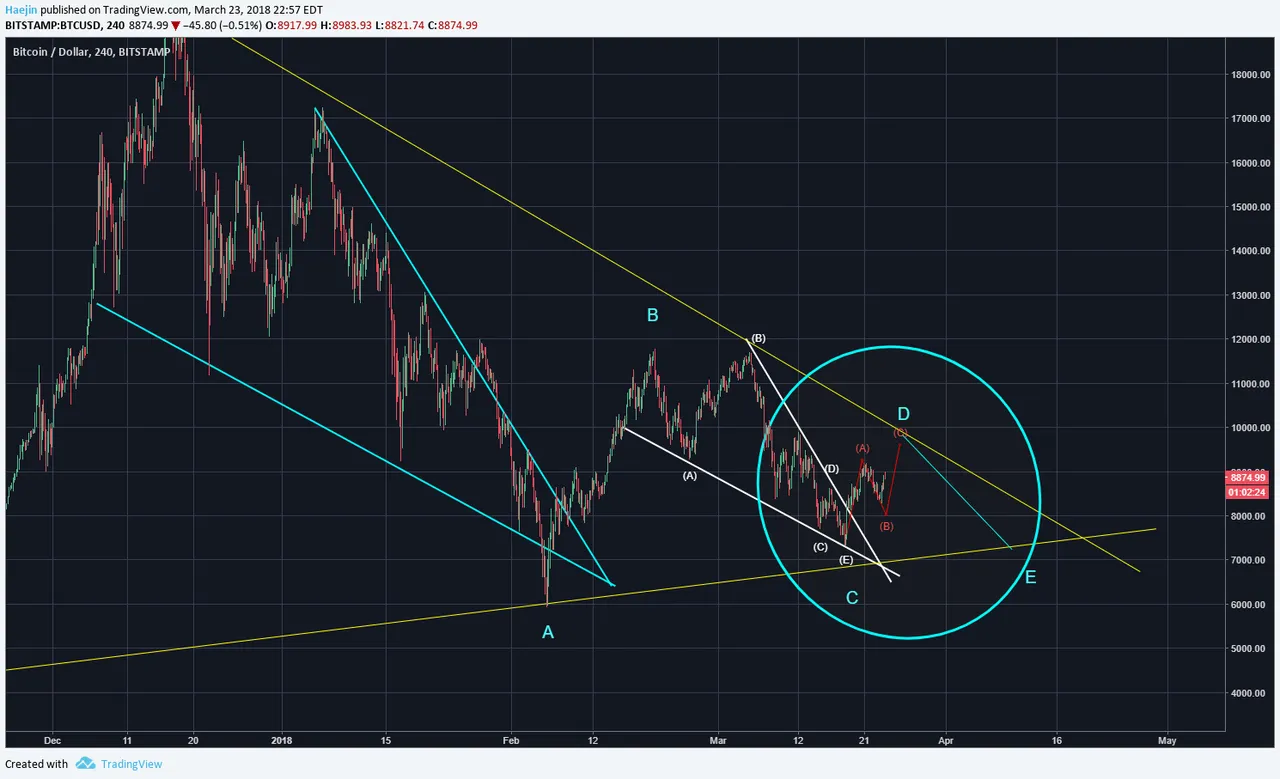
Here is the blue wave D trajectory. The red abc are the subwaves of blue wave D and thus far red A and B are complete and C has already started up.
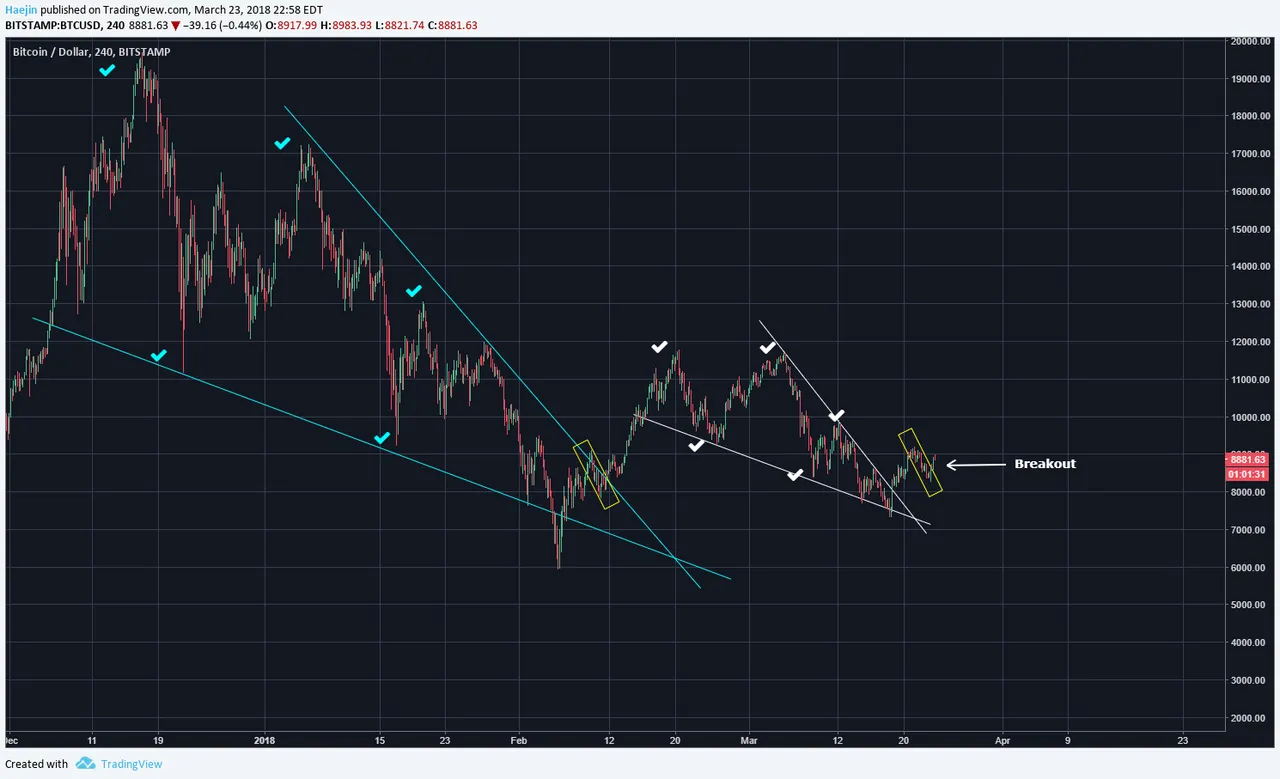
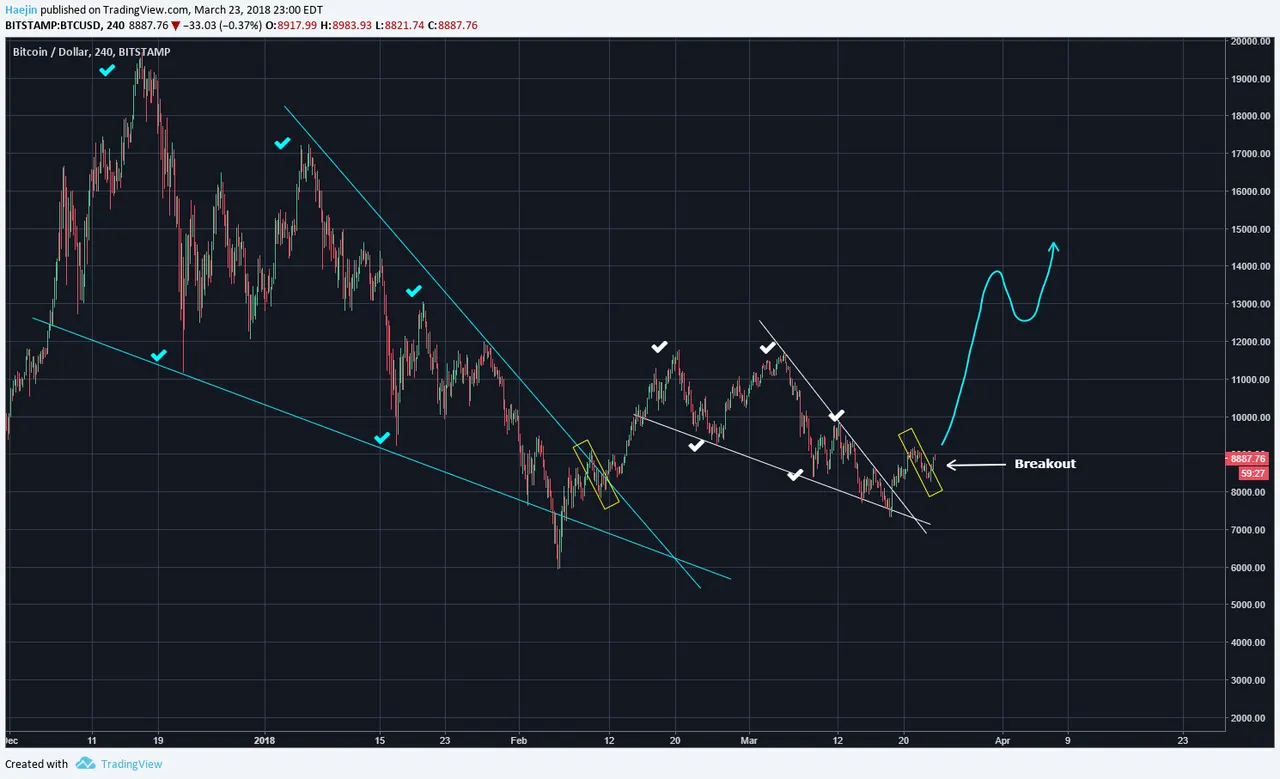
As shown this morning, the fractals are playing out very nicely under close correlation. There is a breakout!
More scribbles to show the projected price pathway. This projection allows the $11,800 persistent resistance to be breached. Let's see what happens overnight.
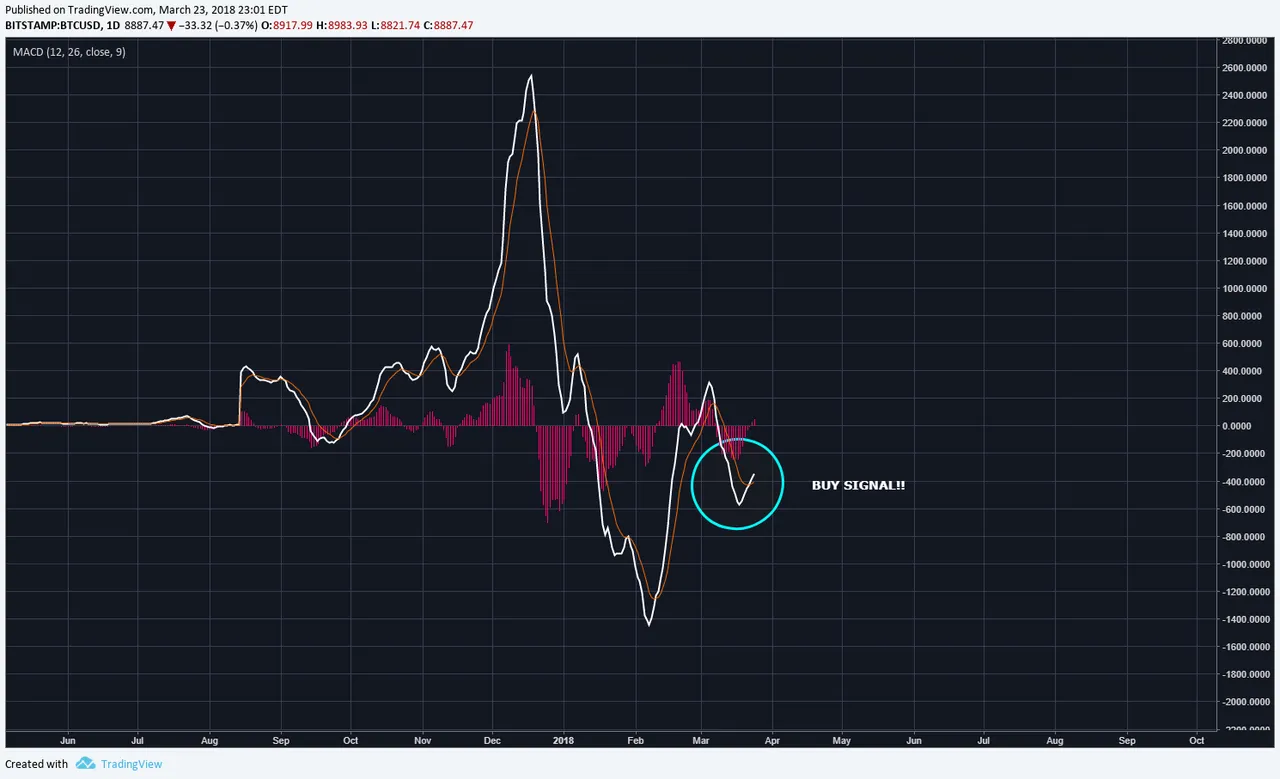
Here is the daily MACD and it's crystal clear that the white MACD line has crossed over the red line. This is a buy signal! Also, the red histogram which is the 9 day moving average, has gone positive. Witnessing such birth of a buying signal and breakout is always exciting to an analyst!
Legal Disclaimer: I am not a financial advisor nor is any content in this article presented as financial advice. The information provided in this blog post and any other posts that I make and any accompanying material is for informational purposes only. It should not be considered financial or investment advice of any kind. One should consult with a financial or investment professional to determine what may be best for your individual needs. Plain English: This is only my opinion, make of it what you wish. What does this mean? It means it's not advice nor recommendation to either buy or sell anything! It's only meant for use as informative or entertainment purposes.
Please consider reviewing these Tutorials on:
Elliott Wave Counting Tutorial #1
Elliott Wave Counting Tutorial #2
Elliott Wave Counting Tutorial #3
Laddering and Buy/Sell Setups.
Laddering Example with EOS
Tutorial on the use of Fibonacci & Elliott Waves
@haejin's Trading Nuggets
Essay: Is Technical Analysis a Quantum Event?
Follow me on Twitter for Real Time Alerts!!
Follow me on StockTwits for UpDates!!
--
--

