
SUMMARY
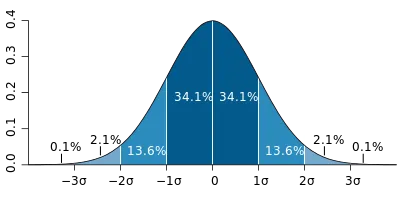
Standard Deviations show the distance from the mean or the square root of the variance. The below bell curve should be quite familiar to most. When a data point is at the 2 std dev level, it's hitting top 13.6%; when at 3 std dev; then it's at the upper tier of 2.1% such that it's above 97.9% from the mean. In other words, such extreme departures away from the mean is not sustainable.
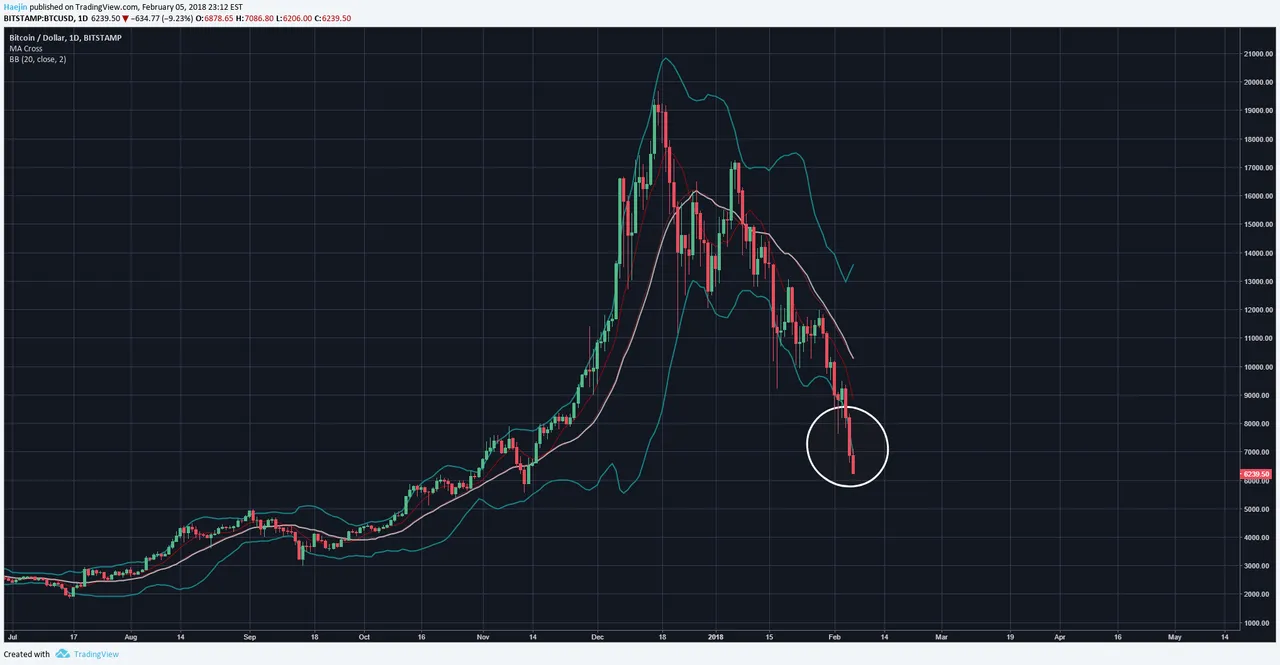
Here is Bitcoin (BTC) where the Bollinger Bands measure to 2 std dev levels. As price is well outside the lower blue line; it has clearly exceeded the 2 std dev and approaching 3 std dev. This level of departure away from the mean is not sustainable. Being at 2.1% means that mean reversion is likely.
Legal Disclaimer: This is only my opinion, make of it what you wish. What does this mean? It means it's not advice nor recommendation to either buy or sell anything! It's only meant for use as informative or entertainment purposes.
Please consider reviewing these Tutorials on:
Elliott Wave Counting Tutorial #1
Elliott Wave Counting Tutorial #2
Elliott Wave Counting Tutorial #3
Laddering and Buy/Sell Setups.
Laddering Example with EOS
Tutorial on the use of Fibonacci & Elliott Waves
@haejin's Trading Nuggets
Essay: Is Technical Analysis a Quantum Event?
Follow me on Twitter for Real Time Alerts!!
Follow me on StockTwits for UpDates!!
--
--

If this blog post has entertained or helped you to profit, please follow, upvote, resteem and/or consider buying me a beer:
BTC Wallet - 1HMFpq4tC7a2acpjD45hCT4WqPNHXcqpof
ETH Wallet - 0x1Ab87962dD59BBfFe33819772C950F0B38554030
LTC Wallet - LecCNCzkt4vjVq2i3bgYiebmr9GbYo6FQf
