
SUMMARY
Note: Returned later than expected from traveling. I will start posting video updates tomorrow.
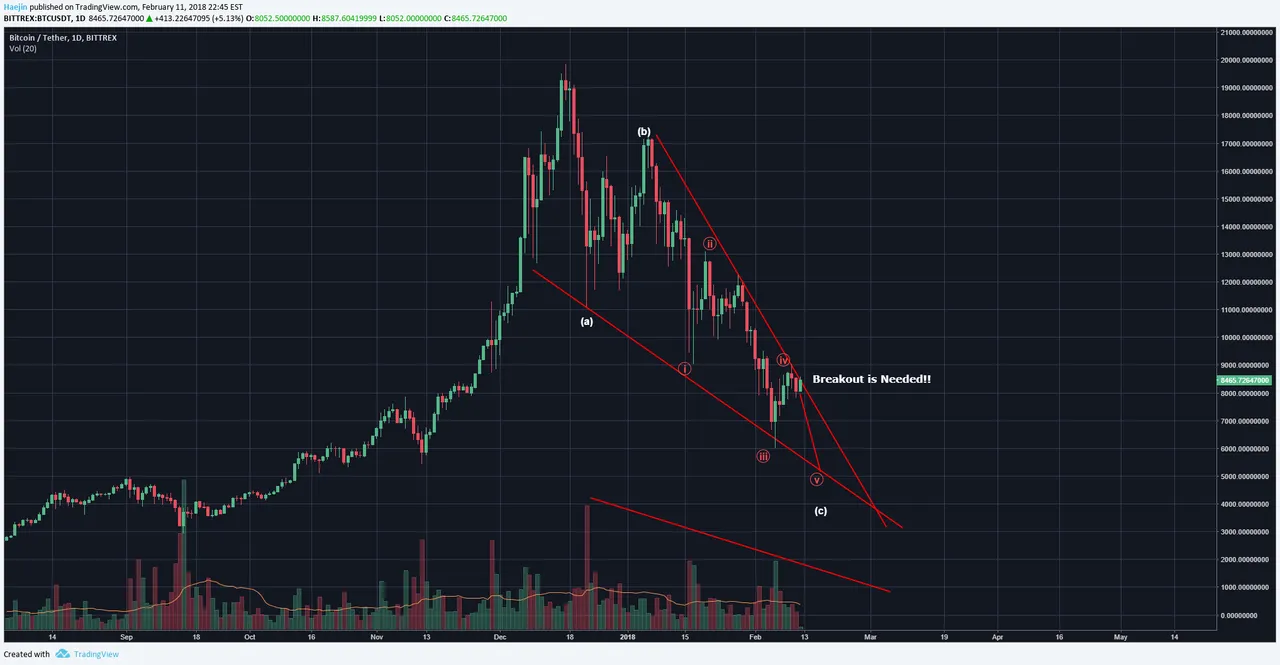
Last night I had posted the below chart showing the wedge pattern with re-drawn upper and lower lines. Also, rather than being labeled as a diagonal, the decline since $20k was Elliott Wave designted as an abc ZigZag. The final C wave was to likely continue to a lower low. However, a price Breakout well out and beyond the upper red line would be an ideal signal for a bullish trend reversal. It would be favorable if overnight price action can make trend line towards $9k.
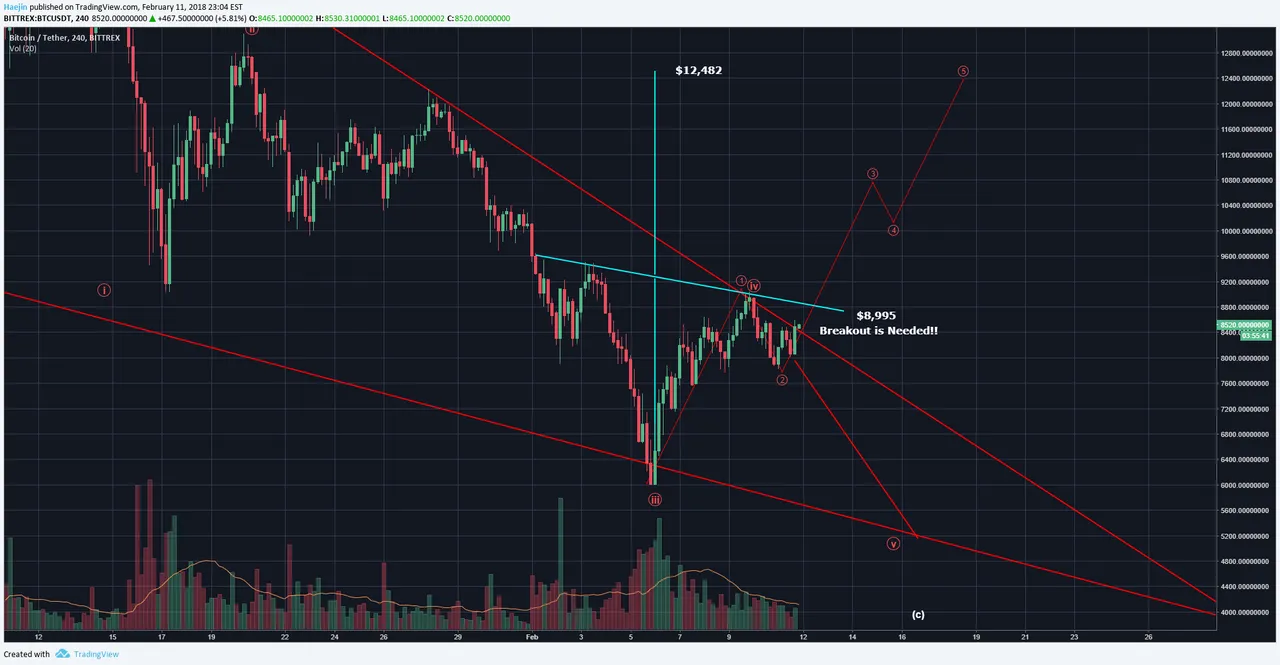
Here is how that can be detailed. IF price completes the inverted, bullish Head & Shoulders patern, then the minimum price travel can be measured at $12,482 or so. This target is acquired through minimum price projection by measuring the distance from bottom of Head formation to the Neck Line (horizontal blue line). This vertical line is then placed above the Neck Line which shows $12,482. How could this be feasible? It needs to first start with a decisive breakout towards $8,995.
Legal Disclaimer: This is only my opinion, make of it what you wish. What does this mean? It means it's not advice nor recommendation to either buy or sell anything! It's only meant for use as informative or entertainment purposes.
Please consider reviewing these Tutorials on:
Elliott Wave Counting Tutorial #1
Elliott Wave Counting Tutorial #2
Elliott Wave Counting Tutorial #3
Laddering and Buy/Sell Setups.
Laddering Example with EOS
Tutorial on the use of Fibonacci & Elliott Waves
@haejin's Trading Nuggets
Essay: Is Technical Analysis a Quantum Event?
Follow me on Twitter for Real Time Alerts!!
Follow me on StockTwits for UpDates!!
--
--

If this blog post has entertained or helped you to profit, please follow, upvote, resteem and/or consider buying me a beer:
BTC Wallet - 1HMFpq4tC7a2acpjD45hCT4WqPNHXcqpof
ETH Wallet - 0x1Ab87962dD59BBfFe33819772C950F0B38554030
LTC Wallet - LecCNCzkt4vjVq2i3bgYiebmr9GbYo6FQf
