
SUMMARY
The current Bitcoin (BTC) correction is bothersome only to the myopic and cashless. As a Trader and Investor, I have experienced so many corrections since 1997 that the only way to come out nearly unscathed is to have plenty of dry powder (cash) raised during the good times, ladder all entries and be disciplined; to me this is an effective de-risking strategy.
The below chart is one I've considered for a while and is near primary in count largely because it fits the time PacMan model or the "Hurry Up & Wait" scenario. IF this is a cycle degree (multi-year) correction, it would be least likely to be swift.
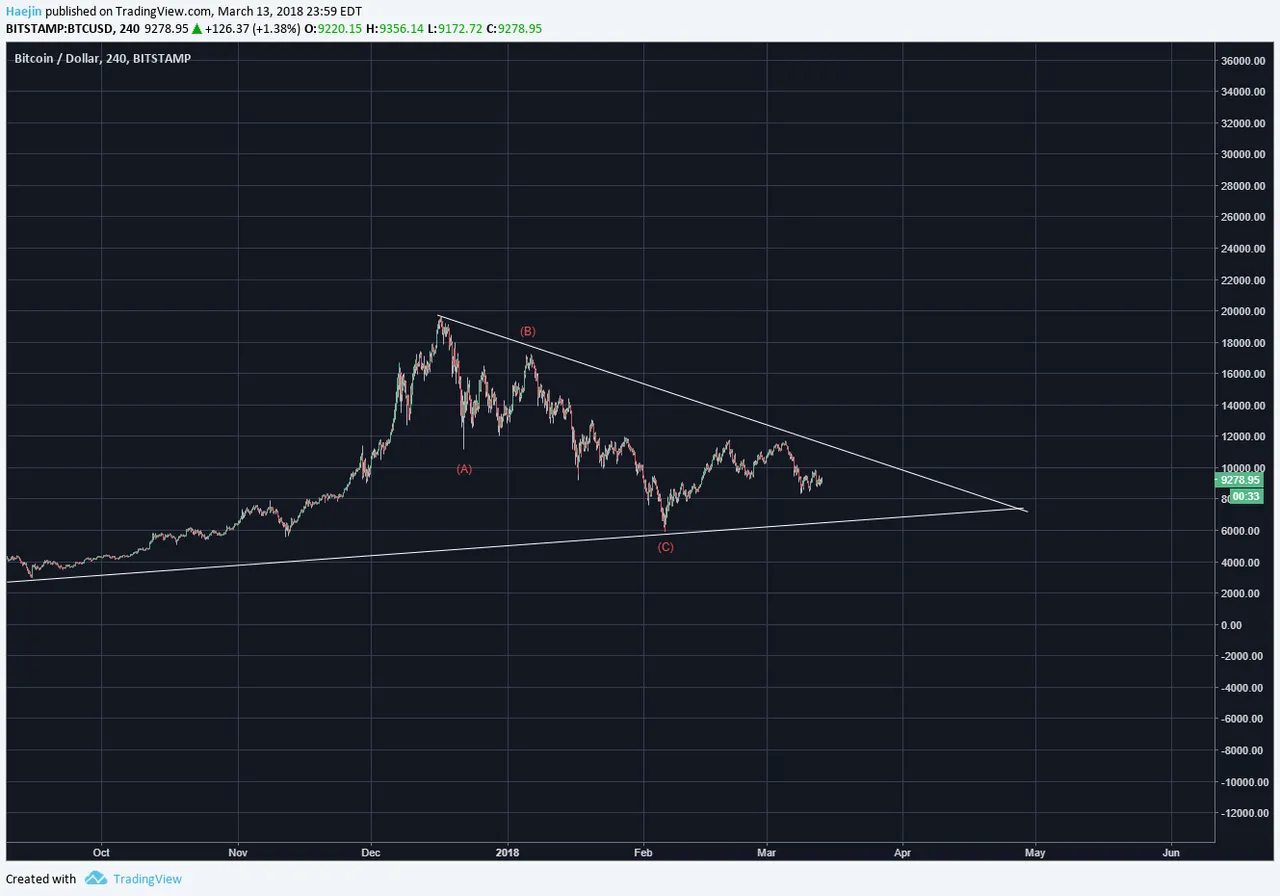
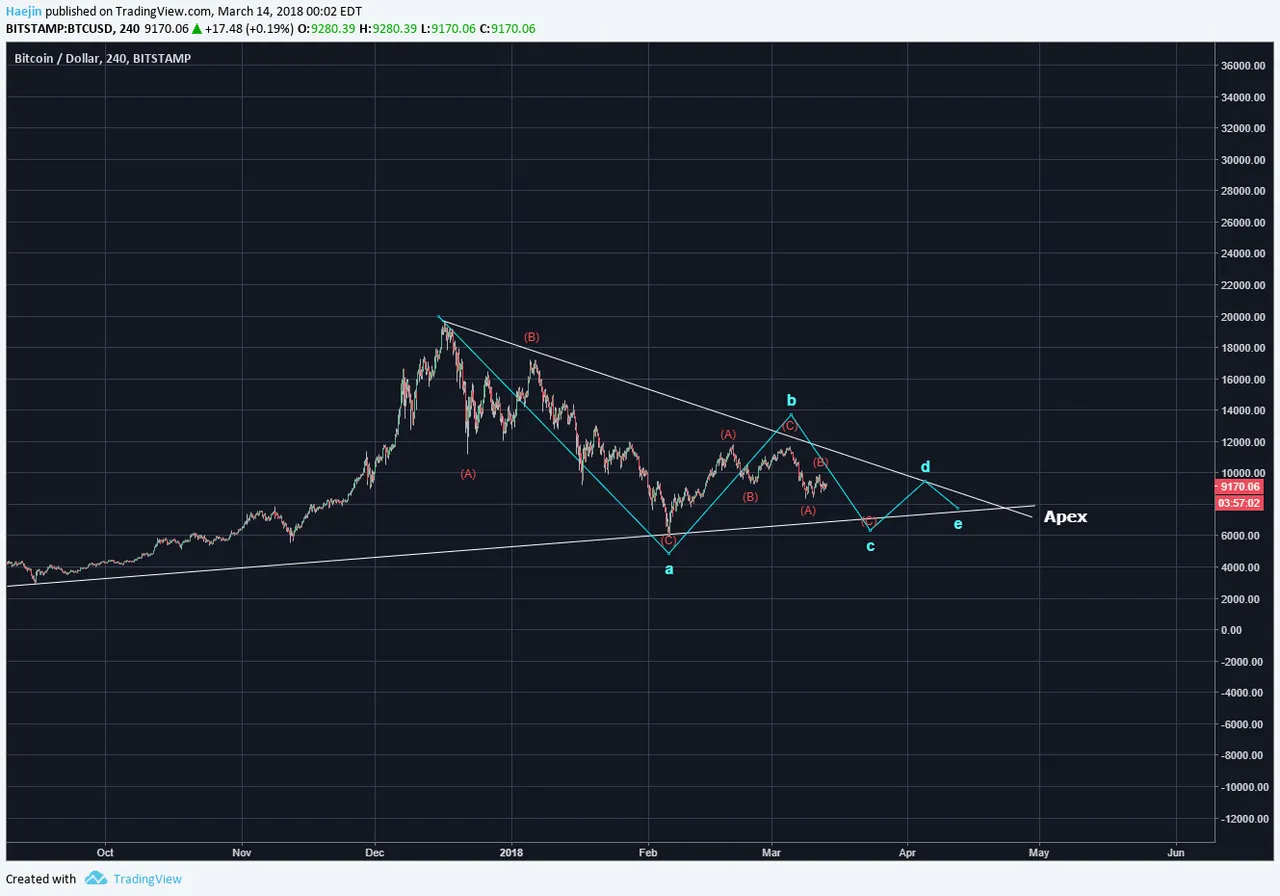
IF this chart is near primary, the first set of red abc reflects the blue wave a and the b also would be complete. Therefore, blue c,d,e remain. IF the whole correction is a large abcde patterned triangle; it would allow Bitcoin to conduct an effective Time PacMan sideways action. Once the blue e wave is complete, the proximity to the Apex would be ideal to initiate a trend reversal. This means that blue C wave would complete in about 8 days (3/22) and wave e to complete at around April 12. IF price decliens towards the $6,900 zone; this count and pattern has becomes a strong candidate for pimary.
Legal Disclaimer: I am not a financial advisor nor is any content in this article presented as financial advice. The information provided in this blog post and any other posts that I make and any accompanying material is for informational purposes only. It should not be considered financial or investment advice of any kind. One should consult with a financial or investment professional to determine what may be best for your individual needs. Plain English: This is only my opinion, make of it what you wish. What does this mean? It means it's not advice nor recommendation to either buy or sell anything! It's only meant for use as informative or entertainment purposes.
Please consider reviewing these Tutorials on:
Elliott Wave Counting Tutorial #1
Elliott Wave Counting Tutorial #2
Elliott Wave Counting Tutorial #3
Laddering and Buy/Sell Setups.
Laddering Example with EOS
Tutorial on the use of Fibonacci & Elliott Waves
@haejin's Trading Nuggets
Essay: Is Technical Analysis a Quantum Event?
Follow me on Twitter for Real Time Alerts!!
Follow me on StockTwits for UpDates!!
--
--

