
SUMMARY
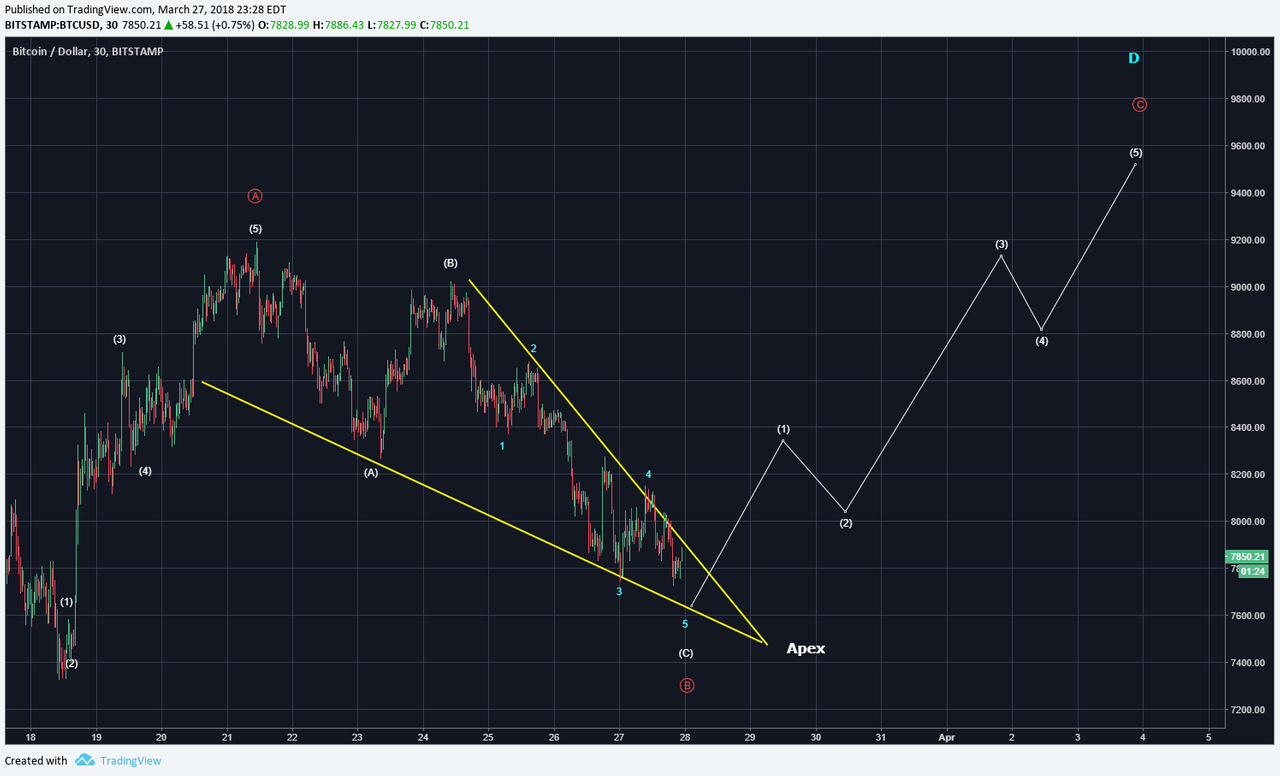
Bitcoin (BTC) is not crashing, IMHO. The price action has not been a panic sell scenario but rather an incremental decline series befitting an ABC corrective move. The below chart shows that BTC is still slowly working on the red B wave of the ABC of blue D. Blue wave 5 seems to be in its final stages.
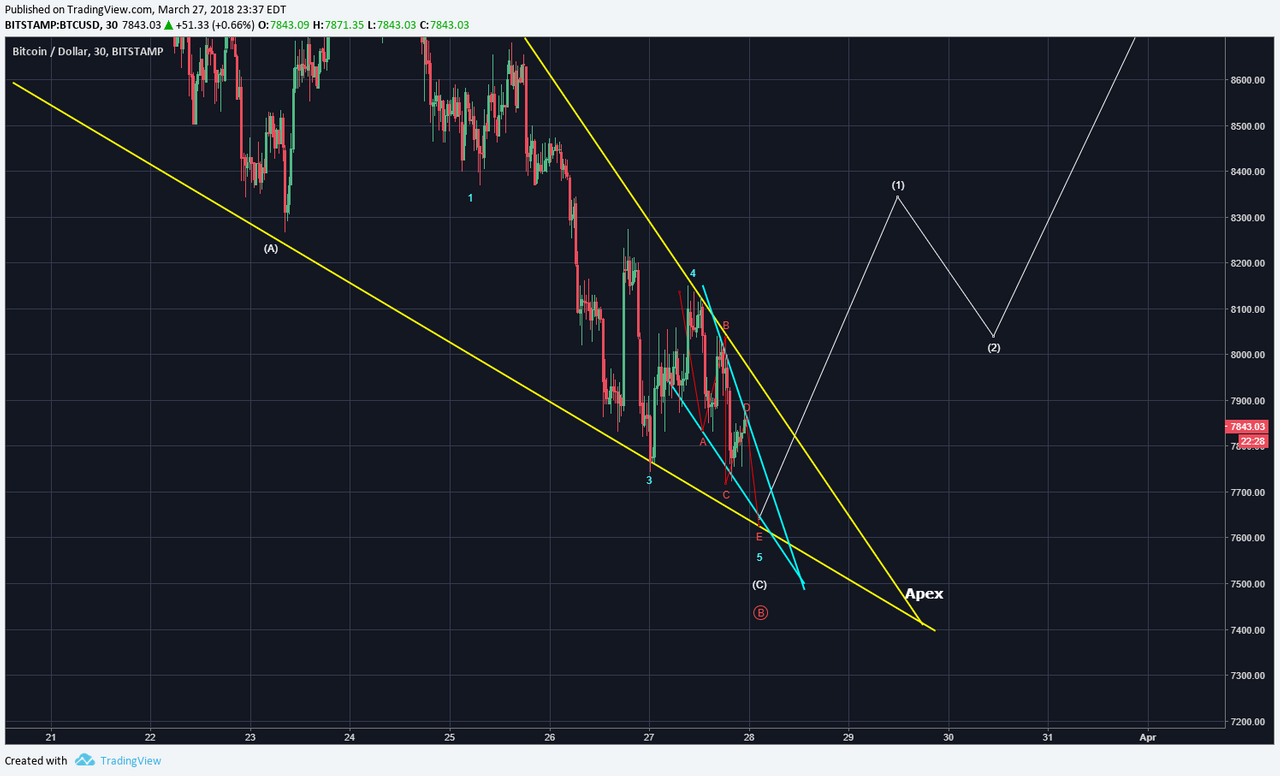
There is a small wedge pattern within a larger wedge. Usually, such embedding of patterns represent a short term oversold state. The blue wedge is labeled as abcde and they are themselves subwaves of the blue wave 5. This should be resolved overnight. IF this pattern and Elliott Wave are correct, then an impulse wave upwards is expected. Clearly, blue wave 5 would bring price more proximal to the Apex....let's see how the overnight activity plays out.
Legal Disclaimer: I am not a financial advisor nor is any content in this article presented as financial advice. The information provided in this blog post and any other posts that I make and any accompanying material is for informational purposes only. It should not be considered financial or investment advice of any kind. One should consult with a financial or investment professional to determine what may be best for your individual needs. Plain English: This is only my opinion, make of it what you wish. What does this mean? It means it's not advice nor recommendation to either buy or sell anything! It's only meant for use as informative or entertainment purposes.
Please consider reviewing these Tutorials on:
Elliott Wave Counting Tutorial #1
Elliott Wave Counting Tutorial #2
Elliott Wave Counting Tutorial #3
Laddering and Buy/Sell Setups.
Laddering Example with EOS
Tutorial on the use of Fibonacci & Elliott Waves
@haejin's Trading Nuggets
Essay: Is Technical Analysis a Quantum Event?
Follow me on Twitter for Real Time Alerts!!
Follow me on StockTwits for UpDates!!
--
--