
SUMMARY
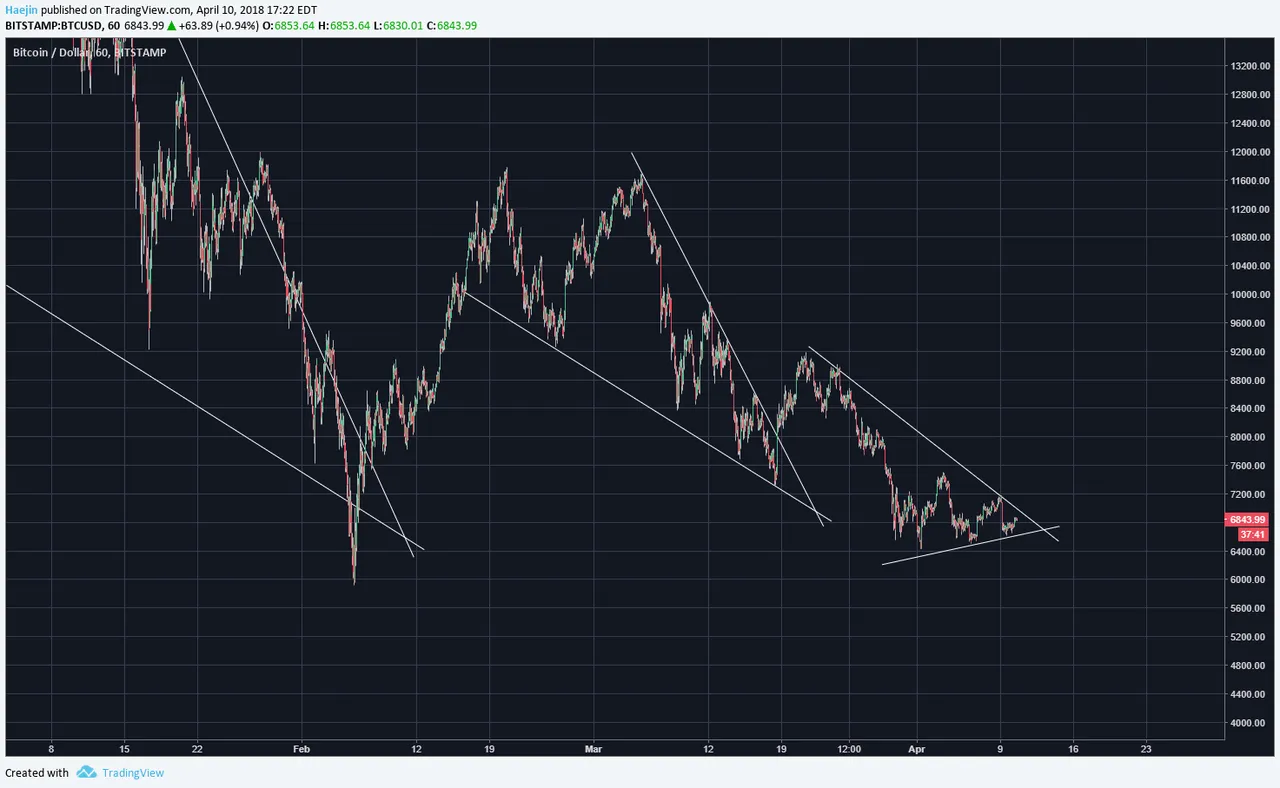
Bitcoin (BTC) is still within the symmetrical trianlge and given the recent three points of higher lows, the breakout is likely be to the upside rather than a crash decline.
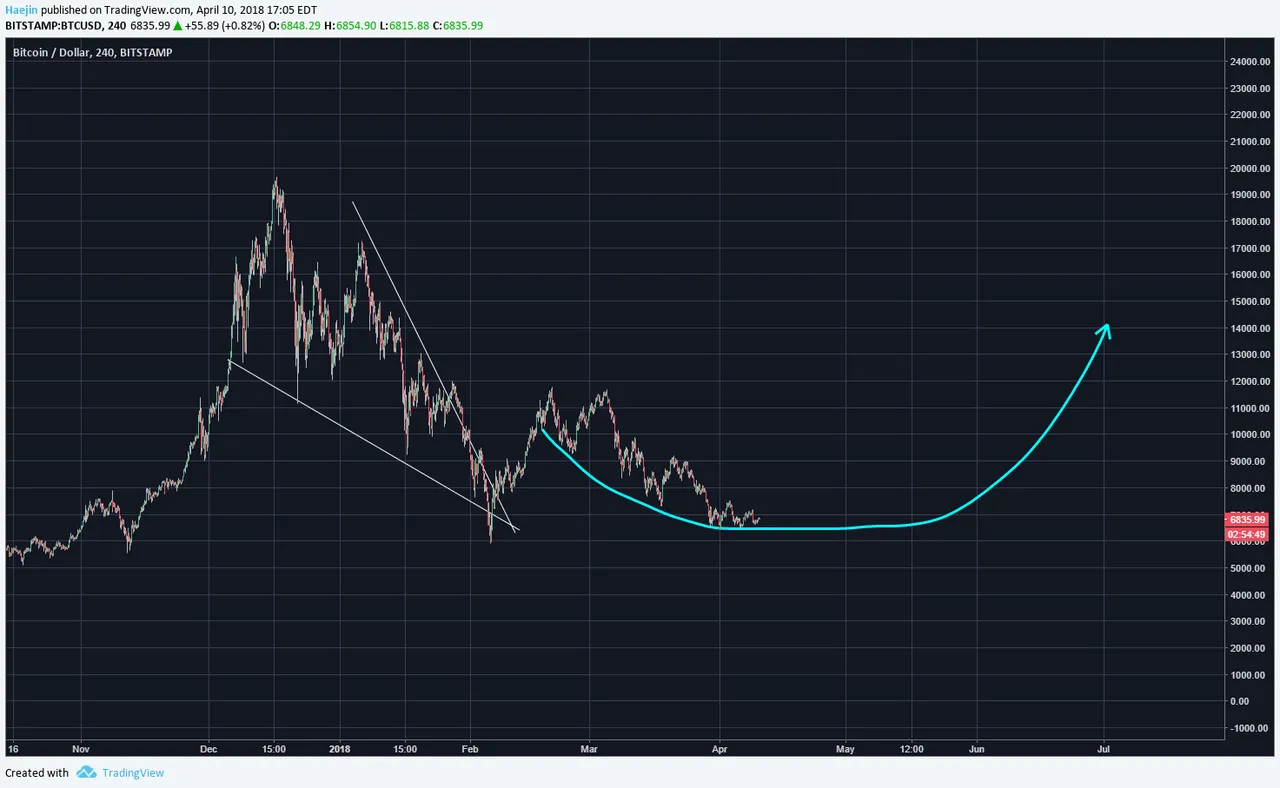
On a wider scoped perspective, the correction could be entering the sideways stage or the basin phase. The blue arrow is contouring a rounded price formation that would rally into July after a period of lateral price movement.
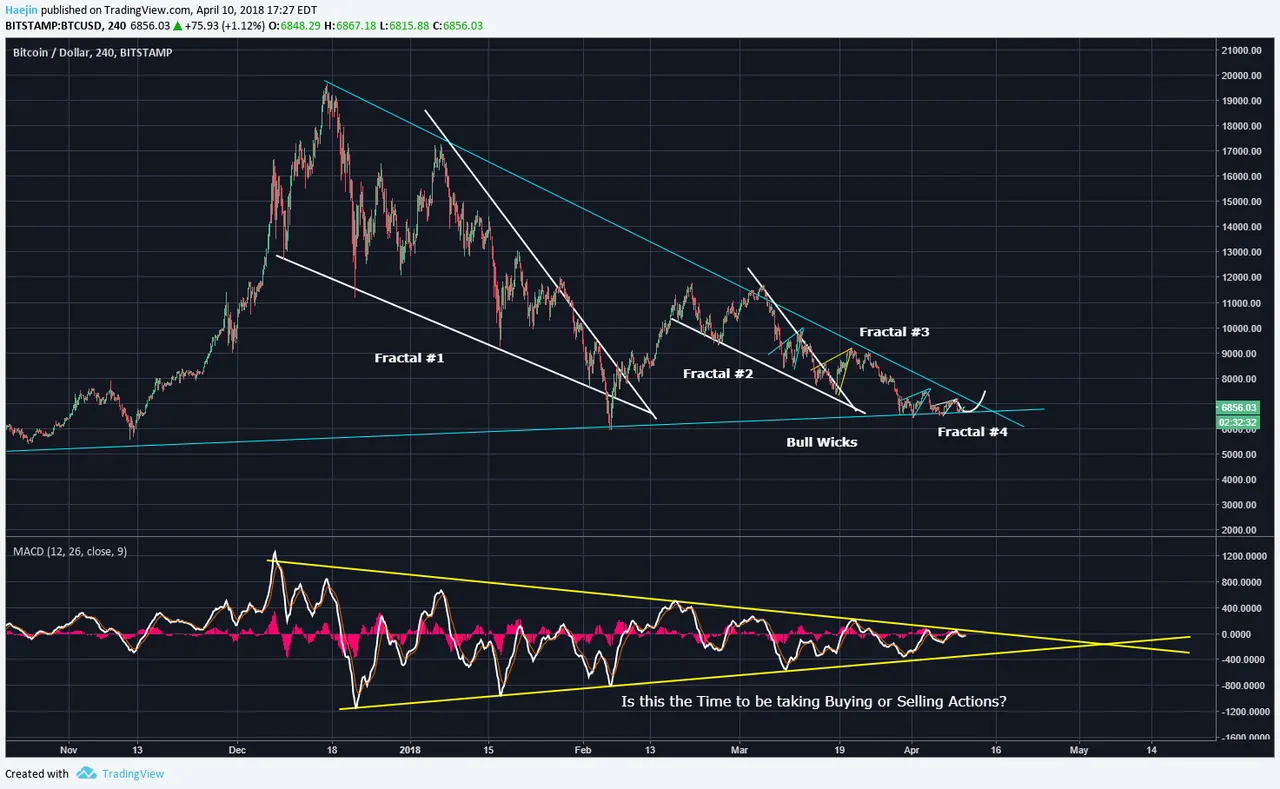
The long term support line (blue) needs to hold. Given how much the seller strength has been sapped, a sizable rally is more likely than a crash scenario. Keep an eye on the MACD because once it breaks upward; price won't be putting in lower lows anymore.
Legal Disclaimer: I am not a financial advisor nor is any content in this article presented as financial advice. The information provided in this blog post and any other posts that I make and any accompanying material is for informational purposes only. It should not be considered financial or investment advice of any kind. One should consult with a financial or investment professional to determine what may be best for your individual needs. Plain English: This is only my opinion, make of it what you wish. What does this mean? It means it's not advice nor recommendation to either buy or sell anything! It's only meant for use as informative or entertainment purposes.
Please consider reviewing these Tutorials on:
Elliott Wave Counting Tutorial #1
Elliott Wave Counting Tutorial #2
Elliott Wave Counting Tutorial #3
Laddering and Buy/Sell Setups.
Laddering Example with EOS
Tutorial on the use of Fibonacci & Elliott Waves
@haejin's Trading Nuggets
Essay: Is Technical Analysis a Quantum Event?
Follow me on Twitter for Real Time Alerts!!
Follow me on StockTwits for UpDates!!
--
--

