
SUMMARY
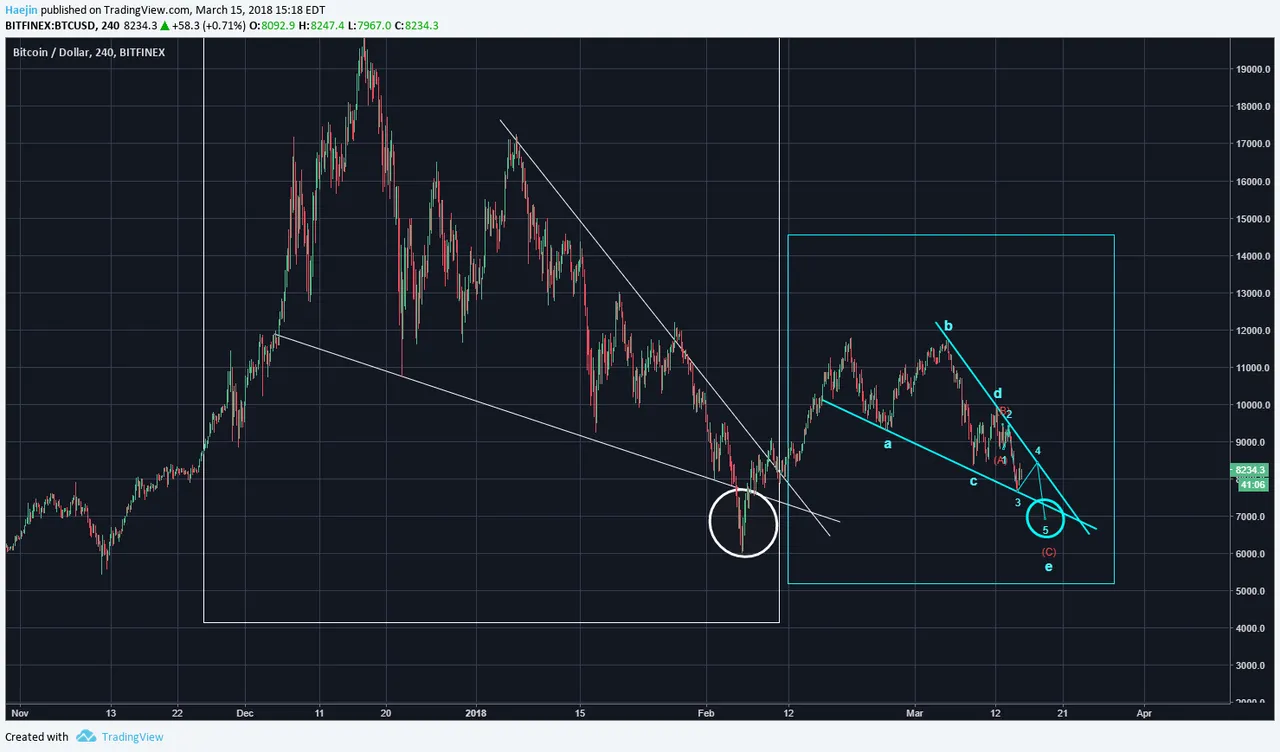
I wanted to further detail Bitcoin's (BTC) wedge fractals that have been shown in earlier posts. The white box cointains the correction from the $20k top to $5,900 which temorarily poked through the bottom triangle line. The blue box contains the smaller fractal and the blue abcde markings show the same potential for price temporarily poke through the bottom support line of the triangle. The final subwave blue e is likely still in the works and could generate the bull wick event through blue wave 5 of c of e.
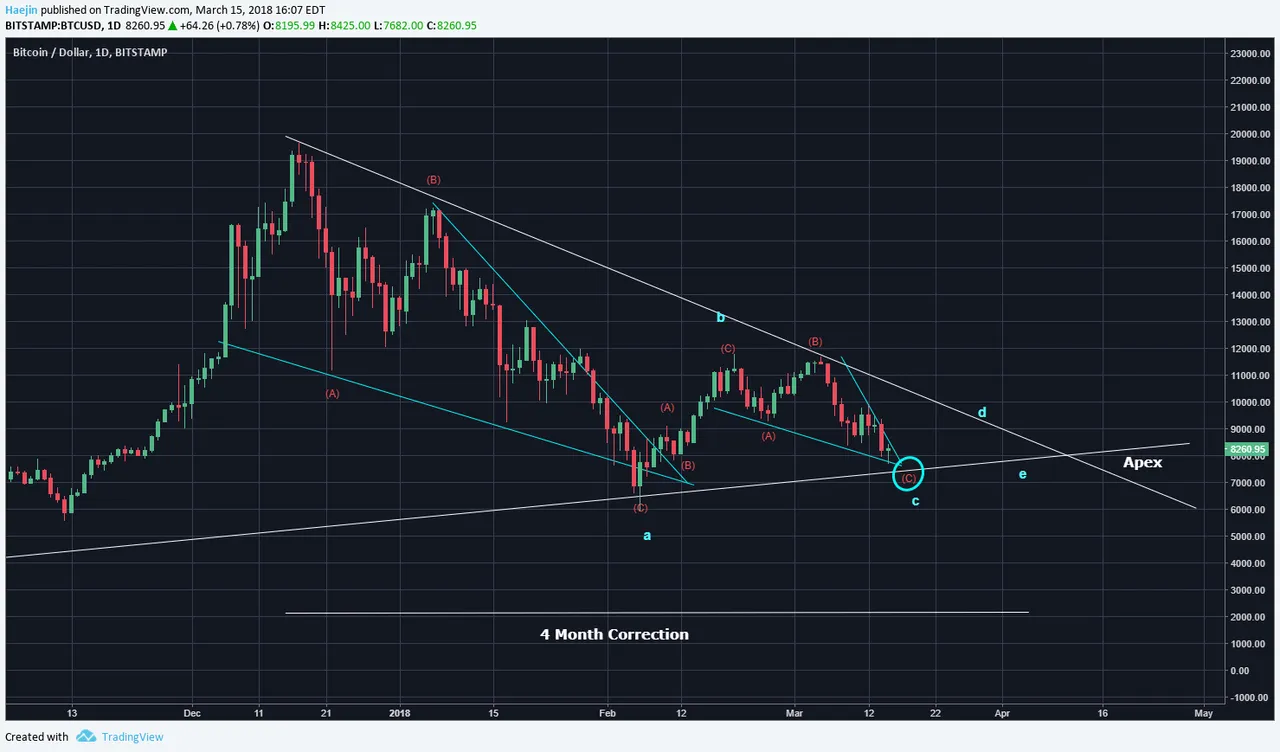
The longer term symmetrical pattern is still maintaining blue c wave to complete at around the 20th. That would provide the onset of blue wave d and the final e which would extend towards the early/mid zone of April. These time projections will need a degree of variance but regardless, the closer to the Apex the better for a trend reversal priming.
Legal Disclaimer: I am not a financial advisor nor is any content in this article presented as financial advice. The information provided in this blog post and any other posts that I make and any accompanying material is for informational purposes only. It should not be considered financial or investment advice of any kind. One should consult with a financial or investment professional to determine what may be best for your individual needs. Plain English: This is only my opinion, make of it what you wish. What does this mean? It means it's not advice nor recommendation to either buy or sell anything! It's only meant for use as informative or entertainment purposes.
Please consider reviewing these Tutorials on:
Elliott Wave Counting Tutorial #1
Elliott Wave Counting Tutorial #2
Elliott Wave Counting Tutorial #3
Laddering and Buy/Sell Setups.
Laddering Example with EOS
Tutorial on the use of Fibonacci & Elliott Waves
@haejin's Trading Nuggets
Essay: Is Technical Analysis a Quantum Event?
Follow me on Twitter for Real Time Alerts!!
Follow me on StockTwits for UpDates!!
--
--

