
SUMMARY
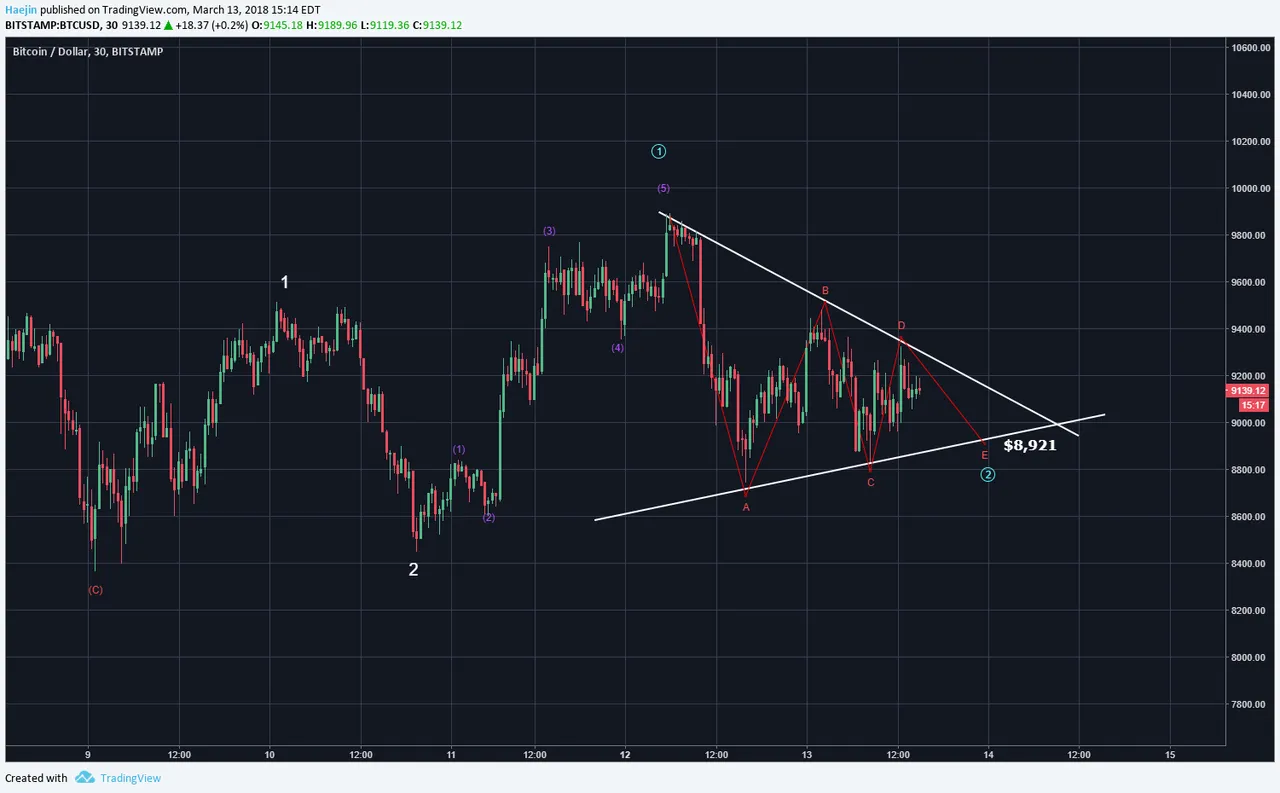
Bitcoin (BTC) is going sideways and often this means it's either a WXY or WXYXZ or a triangle. Patterning out the price moves shows that Bitcoin is likey carving out the final waves of the abcde symmetrical triangle formation. The below 30 minute chart shows that waves a,b,c,d are complete and IF this is the selected pathway; then e wave would likely complete at around $8,921. For Cryptos, when a triangle pattern is discerned, it's most usually a wave 2 or 4. In this case, it's blue wave 2.
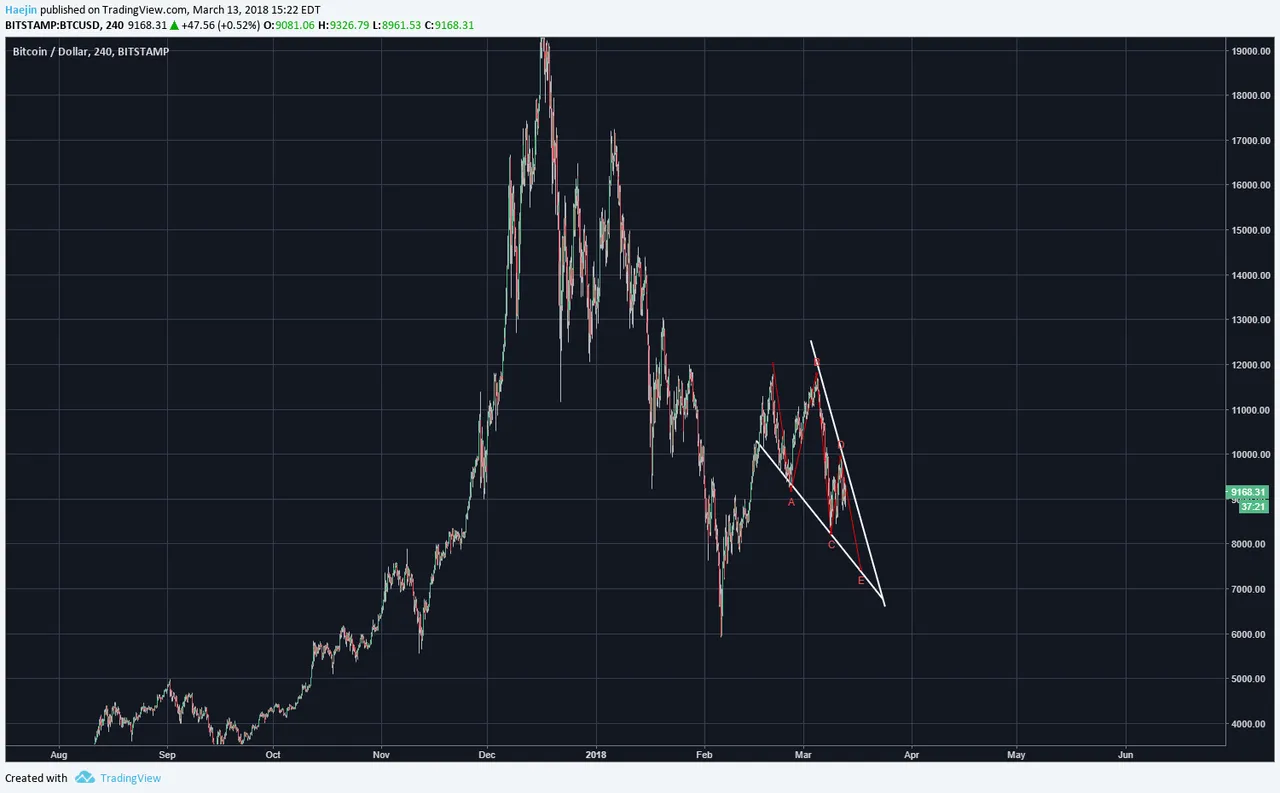
Encompassing the symmetrical pattern could be another overarching downward wedge as shown in the below 4 hour chart. The wedge waves a,b,c,d are complete and e is left to go.
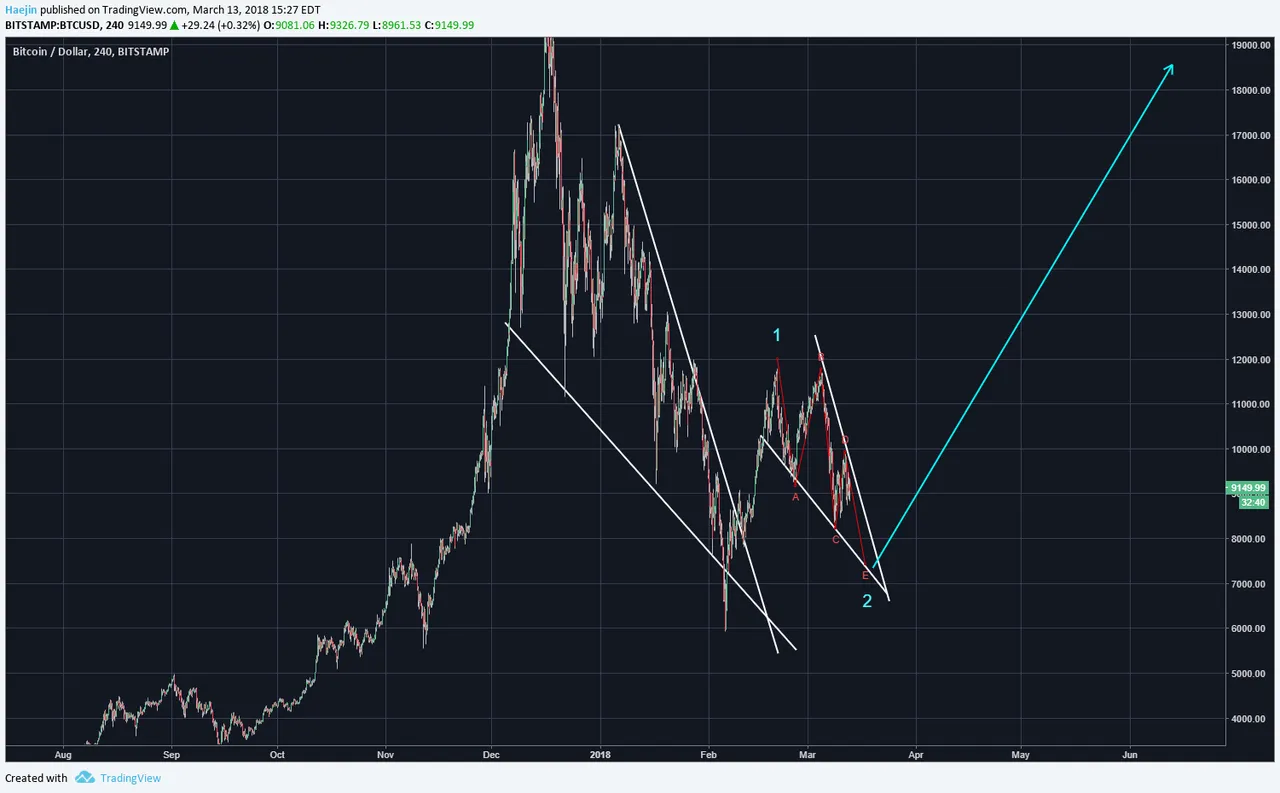
For further consideration is that the fractal degree of similarity between the larger wedge from which Bitcoin breacheed out of and the current smaller fractal. Recall that wedges are quite common for Cryptos as corrective and consolidation phases and thus can consecutively repeat. In effect, this is yet another way of having price go sideways to consume time. So, if the blue wave 1 is complete, then the smaller wedge is likely being designed to fill the role of blue wave 2 and once complete, allow the onset of blue wave 3. Please always remember, I'm an ardent Bitcoin Bull! These corrections represent nothing more than additional opportunities to deploy cash.
Legal Disclaimer: I am not a financial advisor nor is any content in this article presented as financial advice. The information provided in this blog post and any other posts that I make and any accompanying material is for informational purposes only. It should not be considered financial or investment advice of any kind. One should consult with a financial or investment professional to determine what may be best for your individual needs. Plain English: This is only my opinion, make of it what you wish. What does this mean? It means it's not advice nor recommendation to either buy or sell anything! It's only meant for use as informative or entertainment purposes.
Please consider reviewing these Tutorials on:
Elliott Wave Counting Tutorial #1
Elliott Wave Counting Tutorial #2
Elliott Wave Counting Tutorial #3
Laddering and Buy/Sell Setups.
Laddering Example with EOS
Tutorial on the use of Fibonacci & Elliott Waves
@haejin's Trading Nuggets
Essay: Is Technical Analysis a Quantum Event?
Follow me on Twitter for Real Time Alerts!!
Follow me on StockTwits for UpDates!!
--
--

