
SUMMARY
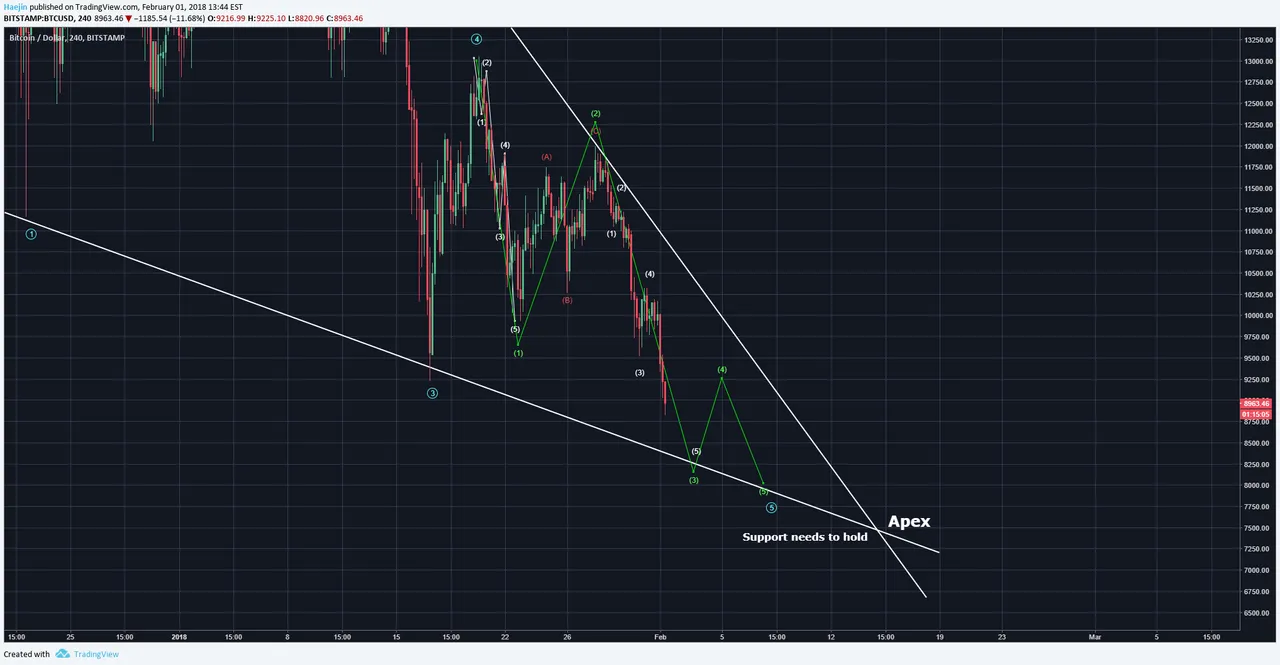
The magnified view of Bitcoin's (BTC) correction is shown in below chart. The key is that the blue waves are pointing towards a region of $7,965 or so. That region is quite close to the Apex (the point at which two lines of the triangle intersect). I believe green wave 4 is likely to be a bounce prior to wave 5 touching the bottom white line of the wedge pattern. While a bullish wick move is also expected, the support can't be broken decisively. It needs to hold even if price temporarily pierces it but needs to return inside the wedge pattern. Green wave 3 should complete today.
Legal Disclaimer: This is only my opinion, make of it what you wish. What does this mean? It means it's not advice nor recommendation to either buy or sell anything! It's only meant for use as informative or entertainment purposes.
Please consider reviewing these Tutorials on:
Elliott Wave Counting Tutorial #1
Elliott Wave Counting Tutorial #2
Elliott Wave Counting Tutorial #3
Laddering and Buy/Sell Setups.
Laddering Example with EOS
Tutorial on the use of Fibonacci & Elliott Waves
@haejin's Trading Nuggets
Essay: Is Technical Analysis a Quantum Event?
Follow me on Twitter for Real Time Alerts!!
Follow me on StockTwits for UpDates!!
--
--

If this blog post has entertained or helped you to profit, please follow, upvote, resteem and/or consider buying me a beer:
BTC Wallet - 1HMFpq4tC7a2acpjD45hCT4WqPNHXcqpof
ETH Wallet - 0x1Ab87962dD59BBfFe33819772C950F0B38554030
LTC Wallet - LecCNCzkt4vjVq2i3bgYiebmr9GbYo6FQf
