
SUMMARY
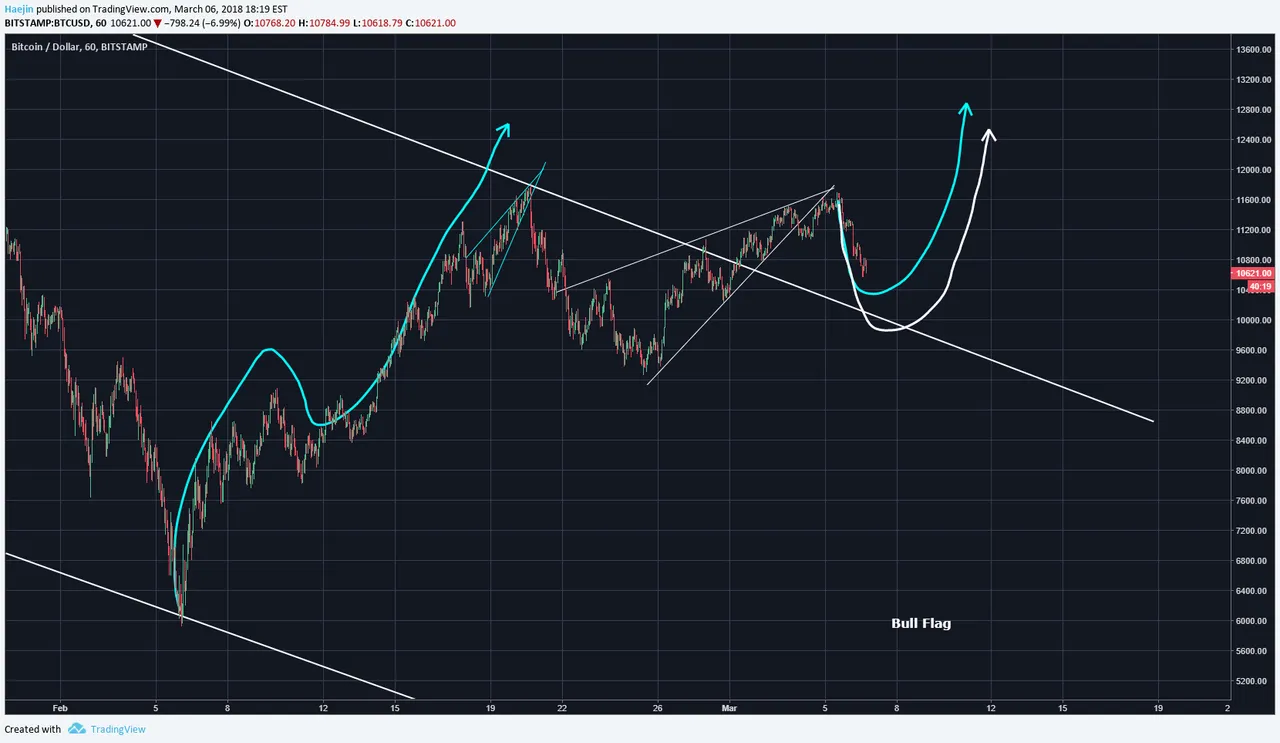
Bitcoin (BTC) price action today has been declining after breaking down from the upward pointing wedge pattern. Thus far, it is and will likely remain a minor correction that coudl follow either the blue or white arrow pathway as shown in below chart:
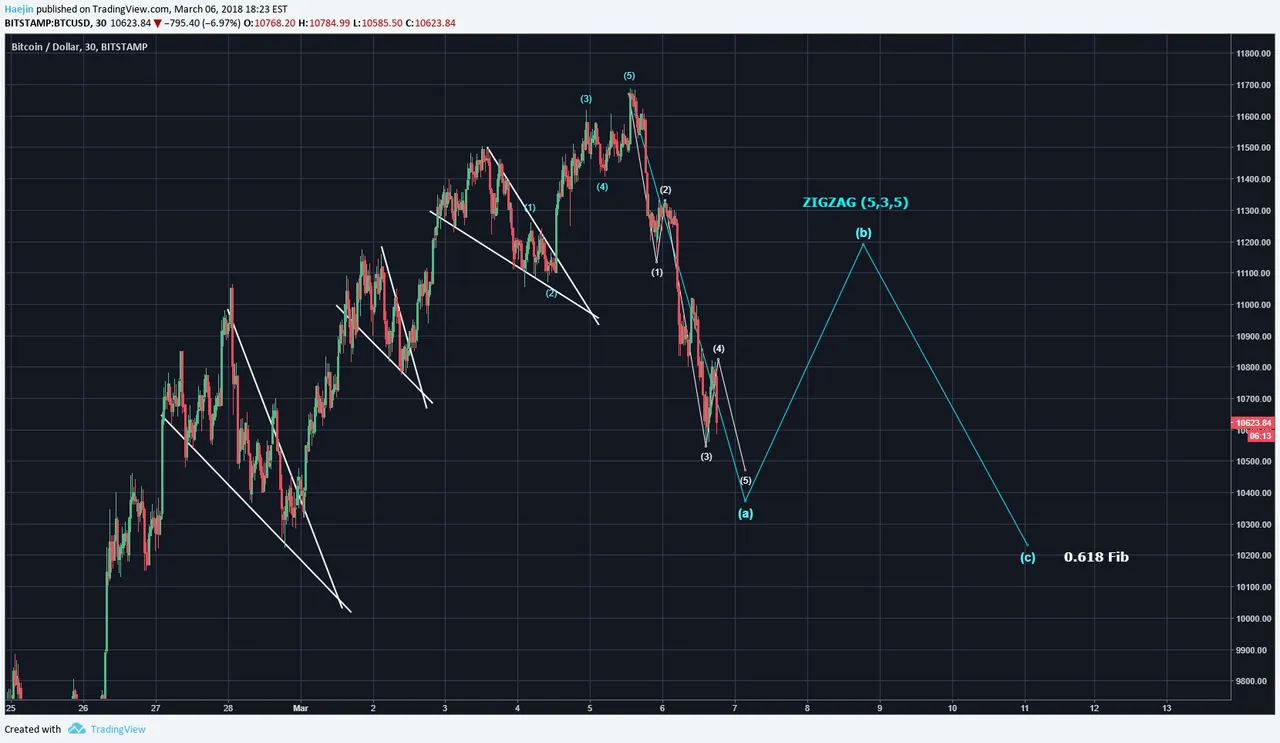
I've updated the Elliott subwaves to count a full impulse with the new price data. I believe blue corrective wave (a) will probably reach the 0.5 Fib zone while and following the (b) wave bounce; the blue (c) could decline towards the 0.618 Fib zone. This correction still has the indicators for a ZigZag (5,3,5) correction. Let's see when the blue (a) completes and the onset of (b) takes place during ovenight price moves.
Legal Disclaimer: I am not a financial advisor nor is any content in this article presented as financial advice. The information provided in this blog post and any other posts that I make and any accompanying material is for informational purposes only. It should not be considered financial or investment advice of any kind. One should consult with a financial or investment professional to determine what may be best for your individual needs. Plain English: This is only my opinion, make of it what you wish. What does this mean? It means it's not advice nor recommendation to either buy or sell anything! It's only meant for use as informative or entertainment purposes.
Please consider reviewing these Tutorials on:
Elliott Wave Counting Tutorial #1
Elliott Wave Counting Tutorial #2
Elliott Wave Counting Tutorial #3
Laddering and Buy/Sell Setups.
Laddering Example with EOS
Tutorial on the use of Fibonacci & Elliott Waves
@haejin's Trading Nuggets
Essay: Is Technical Analysis a Quantum Event?
Follow me on Twitter for Real Time Alerts!!
Follow me on StockTwits for UpDates!!
--
--

