
SUMMARY
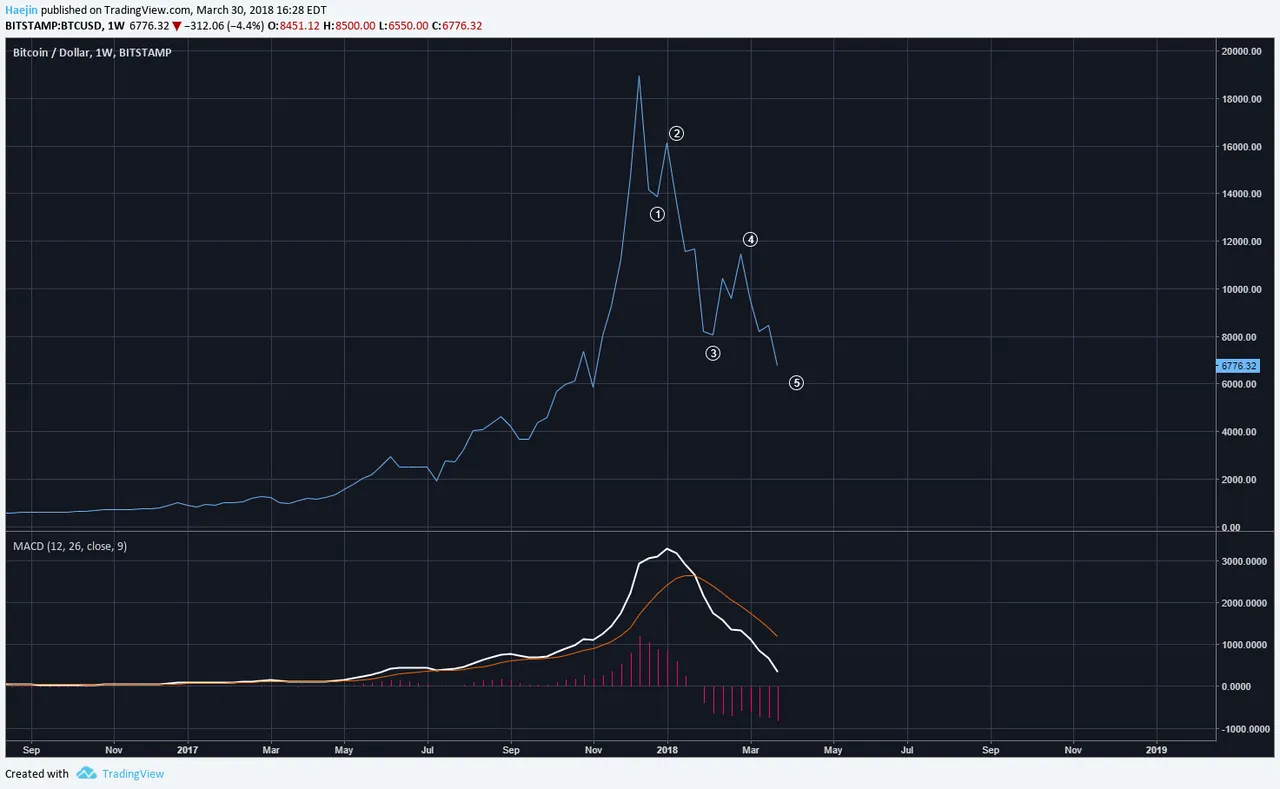
When using the line chart for Bitcoin (BTC), the five waves down is uncanny; as shown in the below chart. The line chart has a smoothing effect which does at times skew the count to a different variation because it removes the barchart details. However, the five wave downs implies a turn is approaching but also still within a larger correction. The MACD on the weekly basis has not started curling upwards; however, once wave 5 is complete; that curl should be more visible.
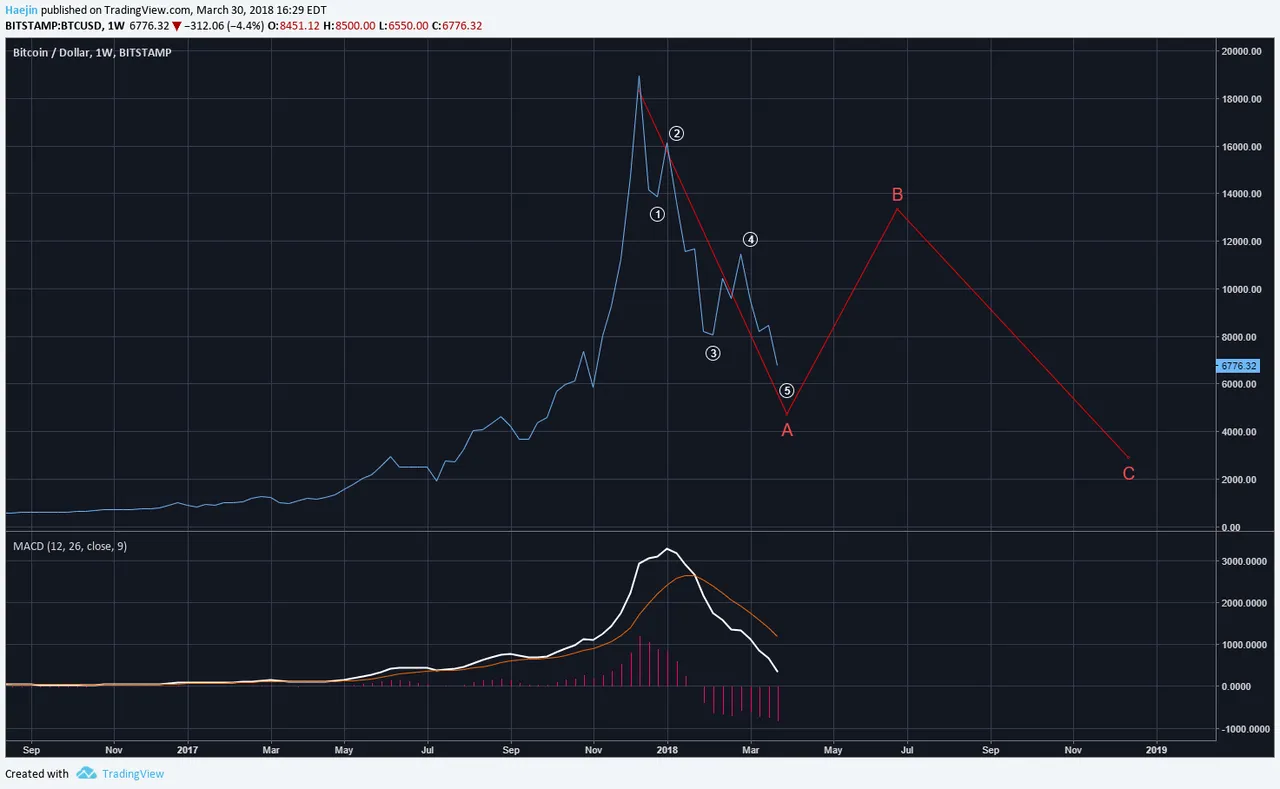
The larger degree of trend correction is shown as an ABC. So, the first five waves down become the subwaves of red A. This would make the correction a ZigZag. The approaching turn could be sizable but not necessarily a trend reversal as it'll likely be a three wave retracement. This B wave would also curl up the white line of the MACD and temporarily have it cross thed red. But, one thing to consider is that an 8+ year climb takes a correction that could very likely take more tha 4 months to correct. The B bounce will likely be misinterpreted as an all clear skies ahead and the shocker of the later wave C down could be painful to all who were not aware.
Legal Disclaimer: I am not a financial advisor nor is any content in this article presented as financial advice. The information provided in this blog post and any other posts that I make and any accompanying material is for informational purposes only. It should not be considered financial or investment advice of any kind. One should consult with a financial or investment professional to determine what may be best for your individual needs. Plain English: This is only my opinion, make of it what you wish. What does this mean? It means it's not advice nor recommendation to either buy or sell anything! It's only meant for use as informative or entertainment purposes.
Please consider reviewing these Tutorials on:
Elliott Wave Counting Tutorial #1
Elliott Wave Counting Tutorial #2
Elliott Wave Counting Tutorial #3
Laddering and Buy/Sell Setups.
Laddering Example with EOS
Tutorial on the use of Fibonacci & Elliott Waves
@haejin's Trading Nuggets
Essay: Is Technical Analysis a Quantum Event?
Follow me on Twitter for Real Time Alerts!!
Follow me on StockTwits for UpDates!!
--
--

