
SUMMARY
NOTE: This is a bit of a long video but I recommend it for viewing as it has tons of details not covered in the summary.
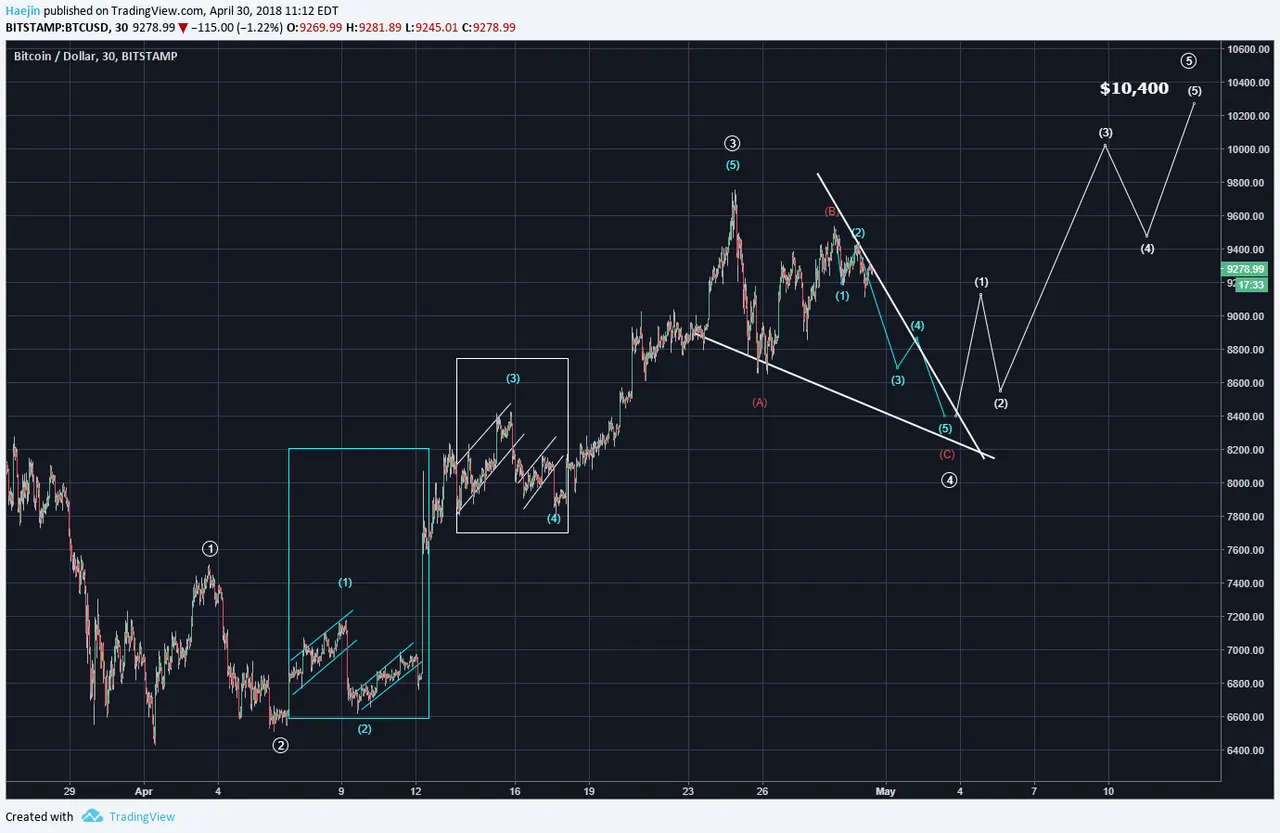
So, Bitcoin (BTC) overnight price breached the lower blue line of the wedge. That brings the ABC ZigZag correction back on the table. The below chart redefines the correction and the blue subwaves are that of the red C wave. The correction as a whole should also pattern out a nice downward wedge.
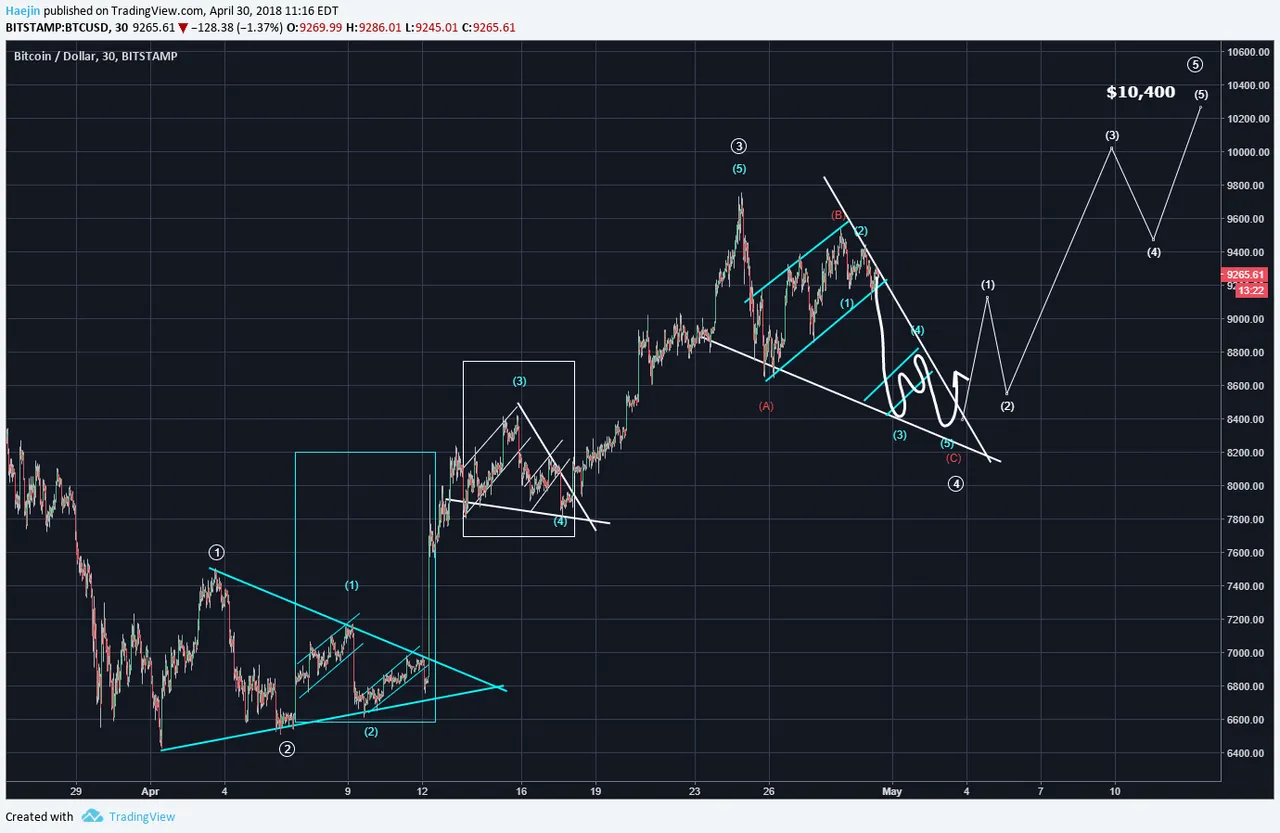
Now, let's take a look at the prior fractals of bear flag pairs. I've drawn out the first bear flag in the current correction and the second has been forward discerned (white line). IF this is correct, the fractal jives well with the five subwaves of wave C and the wedge pattern. Note also that the same wedge pattern ca be drawn for the second fractal (white box) while the first box has a symmetrical triangle.
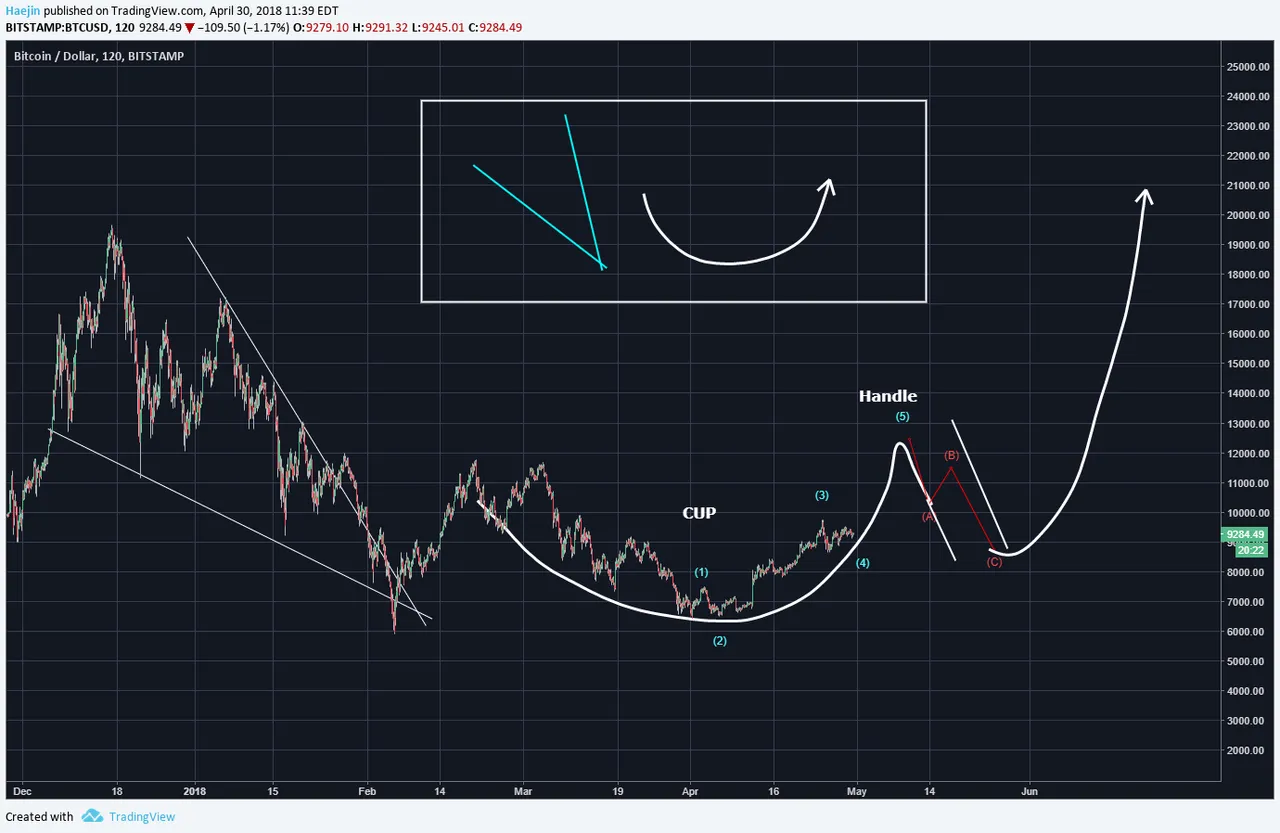
It's important to never be buried only in the short term wiggles and squigles of price movement. The below longer term chart is important. As you've seen, many Cryptos generate consolidation pattern in sequence; either two series of rounded bottom or wedges or whatever. Once sequence is that of two different types of consolidation patterns. The most common is that of a downward wedge and a rounded formation. Thus far, the longer term price movement of Bitcoin has completed the large downward wedge as you can see in the chart below. The rounded price formation has been in my consideration for a while and since the price movements have been confirming it more and more; the below shows the potential of a genuine Cup & Handle pattern. The five blue waves up would complete the right wall of the Cup and since the handle will coincide with the ABC correcetion following a complete five wave motive; the decline will likely be 0.5 Fib level. It's probably after this that the real fireworks will start firing! Now, the handle portion is NOT required; it could just be the rounded formation as well. Still; the longer term jives well with the patterns and Elliott Waves.
Legal Disclaimer: I am not a financial advisor nor is any content in this article presented as financial advice. The information provided in this blog post and any other posts that I make and any accompanying material is for informational purposes only. It should not be considered financial or investment advice of any kind. One should consult with a financial or investment professional to determine what may be best for your individual needs. Plain English: This is only my opinion, make of it what you wish. What does this mean? It means it's not advice nor recommendation to either buy or sell anything! It's only meant for use as informative or entertainment purposes.
Please consider reviewing these Tutorials on:
Elliott Wave Counting Tutorial #1
Elliott Wave Counting Tutorial #2
Elliott Wave Counting Tutorial #3
Laddering and Buy/Sell Setups.
Laddering Example with EOS
Tutorial on the use of Fibonacci & Elliott Waves
@haejin's Trading Nuggets
Essay: Is Technical Analysis a Quantum Event?
Follow me on Twitter for Real Time Alerts!!
Follow me on StockTwits for UpDates!!
--
--

