
SUMMARY
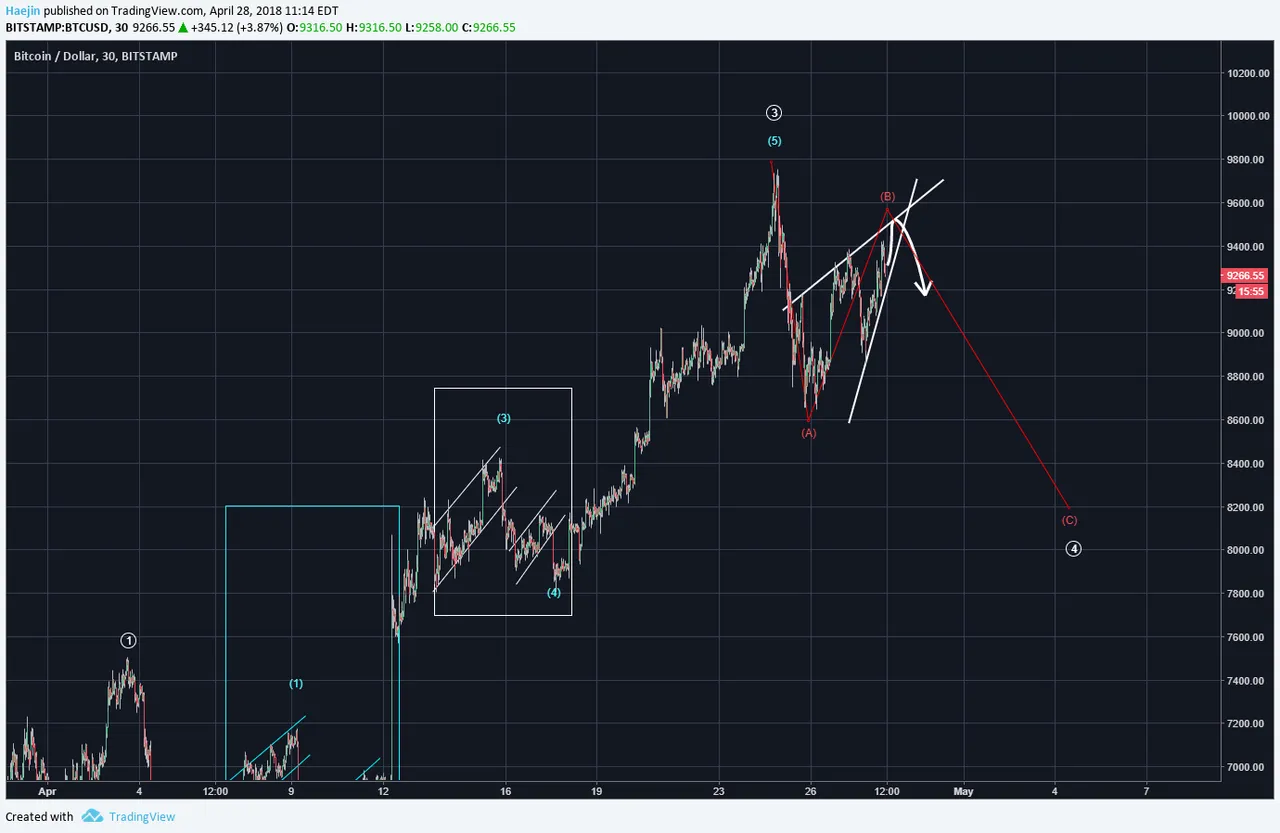
Bitcoin (BTC) overnight price has recovered a bit and a bullish scenario would look like the below chart. The Elliott Wave 1,2,3,4,5 could have started for the higher degree wave 5.

However, the upward wedgey nature of the pattern still points to a maybe larger scale abc (red) correction for wave 4. IF this is the case, then perhaps one more incremental rise could bring the price closer to the apex and wave c could onset. The video has lots more details!
Legal Disclaimer: I am not a financial advisor nor is any content in this article presented as financial advice. The information provided in this blog post and any other posts that I make and any accompanying material is for informational purposes only. It should not be considered financial or investment advice of any kind. One should consult with a financial or investment professional to determine what may be best for your individual needs. Plain English: This is only my opinion, make of it what you wish. What does this mean? It means it's not advice nor recommendation to either buy or sell anything! It's only meant for use as informative or entertainment purposes.
Please consider reviewing these Tutorials on:
Elliott Wave Counting Tutorial #1
Elliott Wave Counting Tutorial #2
Elliott Wave Counting Tutorial #3
Laddering and Buy/Sell Setups.
Laddering Example with EOS
Tutorial on the use of Fibonacci & Elliott Waves
@haejin's Trading Nuggets
Essay: Is Technical Analysis a Quantum Event?
Follow me on Twitter for Real Time Alerts!!
Follow me on StockTwits for UpDates!!
--
--

