
SUMMARY
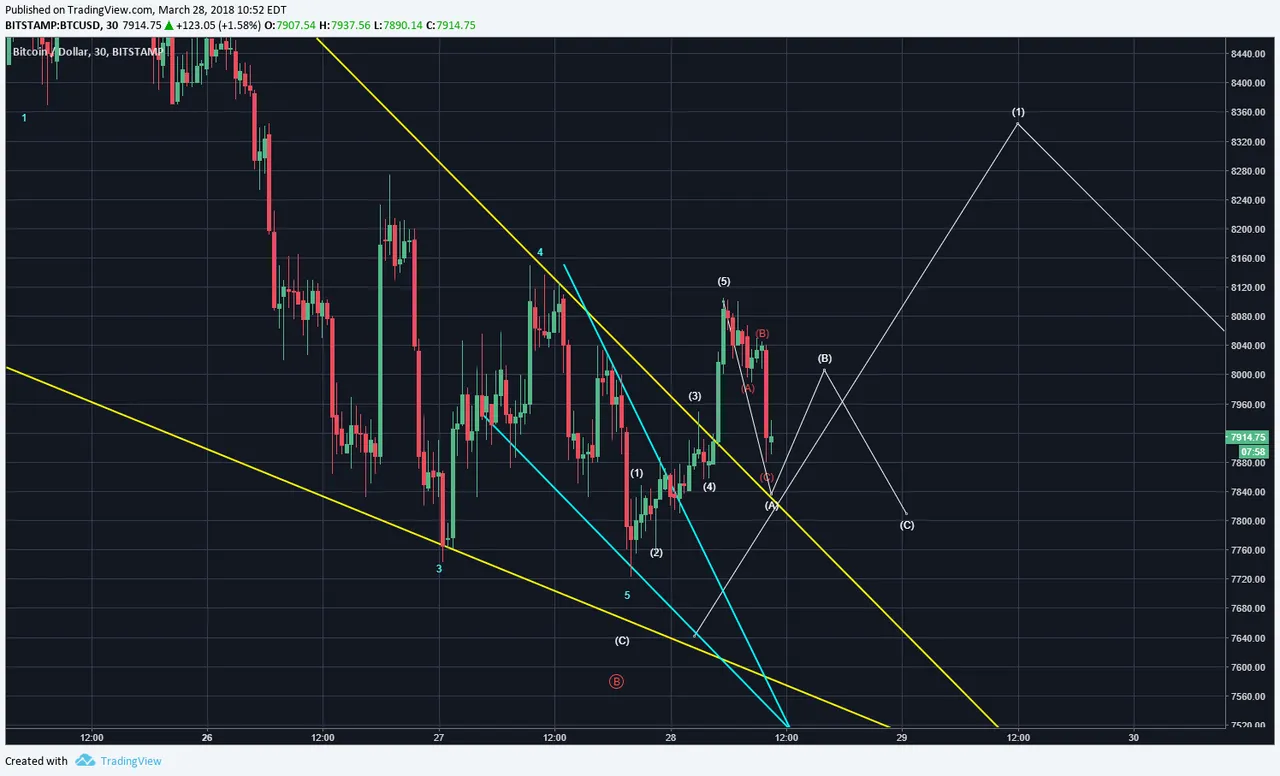
So, overnight price action for Bitcoin (BTC) has broken out of the blue and the yellow wedge patterns. Thus far, the breakout counts to five waves and currently, a minor correction is taking place. Most of today will likely be consumed in putting in some form of an abc or some other of the 36 possible combinations. Even with this breakout, there is probable scenario of seeing a lower low.
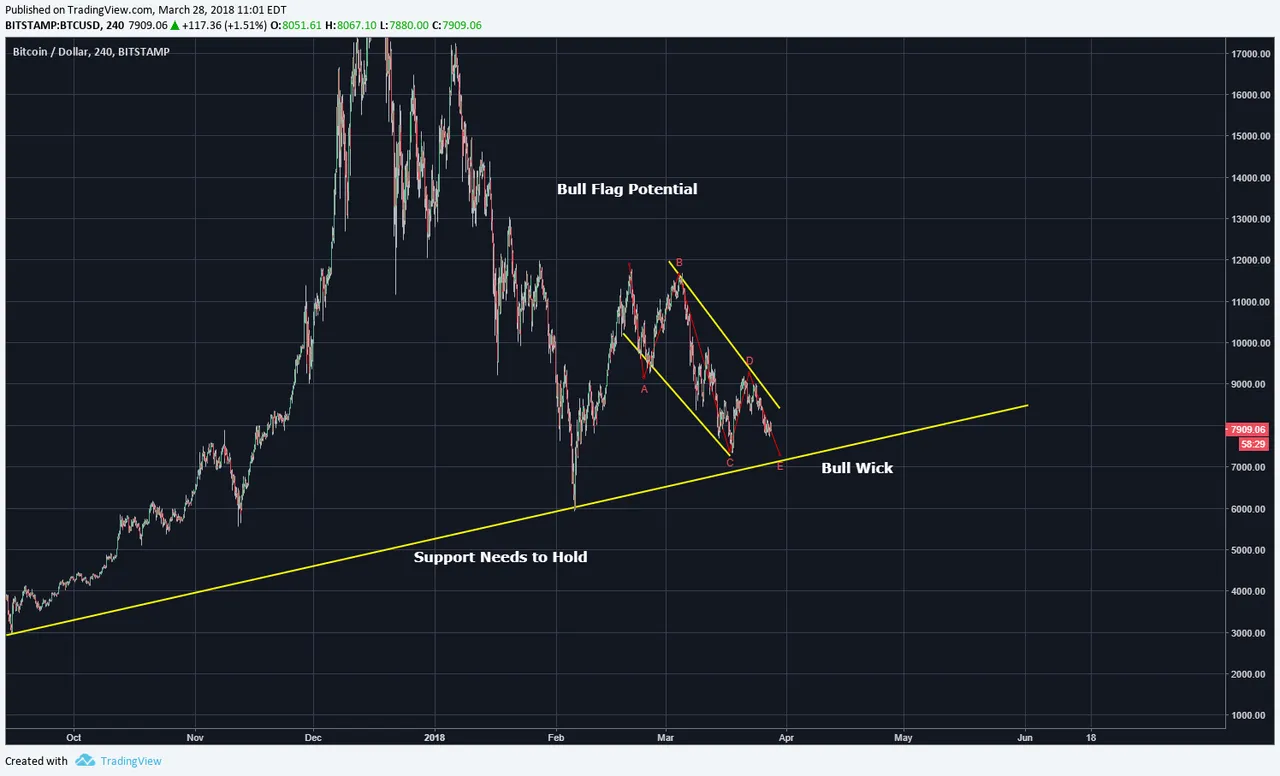
The below chart shows the bull flag potential with price traversing within downward pointing parallel lines. This is labeled as red abcde and almost all waves are near completed. The long term support could be touched once more or temporarily pierced to place the final E wave. Since C did not touch the lower support line, E is likely to do so and this would cause that lower low eventhough price broke out of the yellow and blue wedges. Let's see how the corrective price action plays out today.
Legal Disclaimer: I am not a financial advisor nor is any content in this article presented as financial advice. The information provided in this blog post and any other posts that I make and any accompanying material is for informational purposes only. It should not be considered financial or investment advice of any kind. One should consult with a financial or investment professional to determine what may be best for your individual needs. Plain English: This is only my opinion, make of it what you wish. What does this mean? It means it's not advice nor recommendation to either buy or sell anything! It's only meant for use as informative or entertainment purposes.
Please consider reviewing these Tutorials on:
Elliott Wave Counting Tutorial #1
Elliott Wave Counting Tutorial #2
Elliott Wave Counting Tutorial #3
Laddering and Buy/Sell Setups.
Laddering Example with EOS
Tutorial on the use of Fibonacci & Elliott Waves
@haejin's Trading Nuggets
Essay: Is Technical Analysis a Quantum Event?
Follow me on Twitter for Real Time Alerts!!
Follow me on StockTwits for UpDates!!
--
--

