
SUMMARY
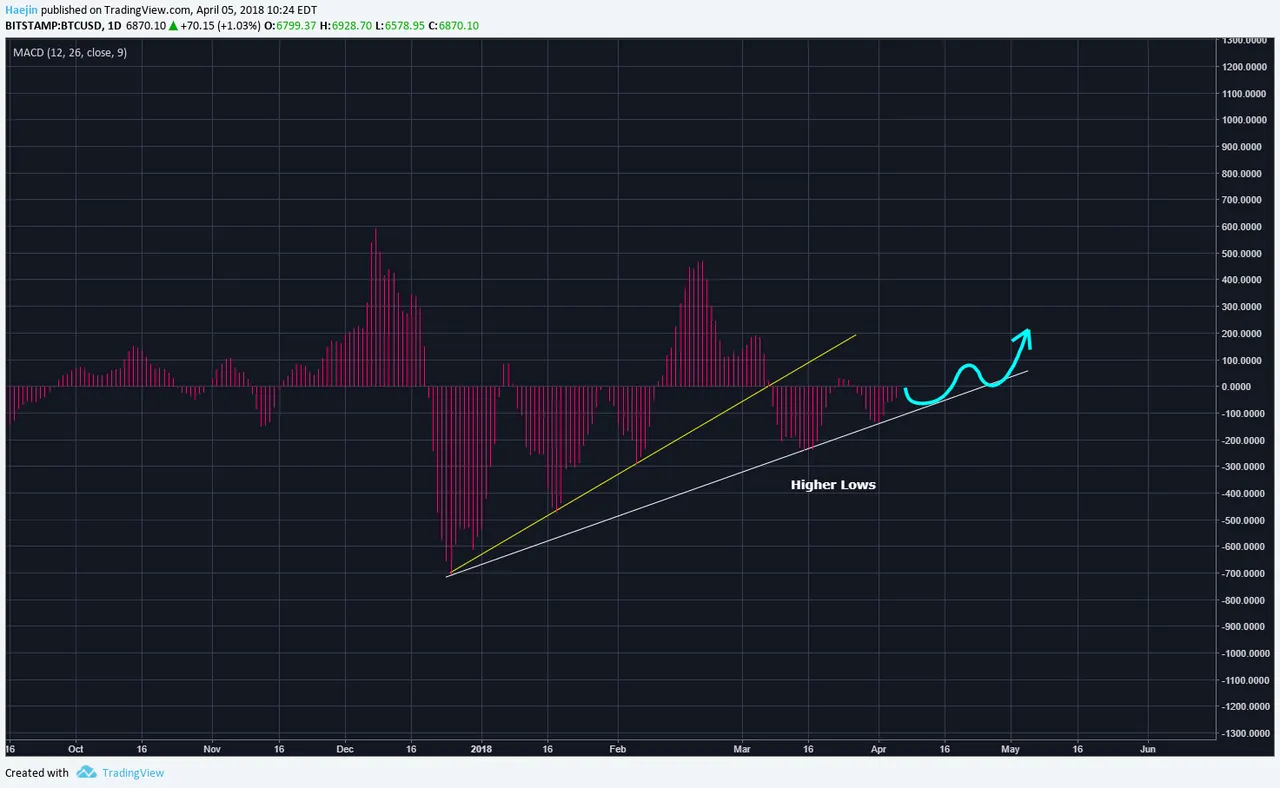
Here is the daily MACD histogram for Bitcoin (BTC). The higher low series in two trend, yellow and white, is quite attractive with bullish connotations. The fact that the histogram is the 9 day moving average compared to the white line indicator which is 12 days and the red line indicator the 26 day; the histogram moves and turns faster and earlier. I use it as an early warning or indication. The higher low series is telling me that a turn is likely and that turn is probably up. Also, it tells me that the lagging indicators (white and red lines) will also follow. It's very encouraging.
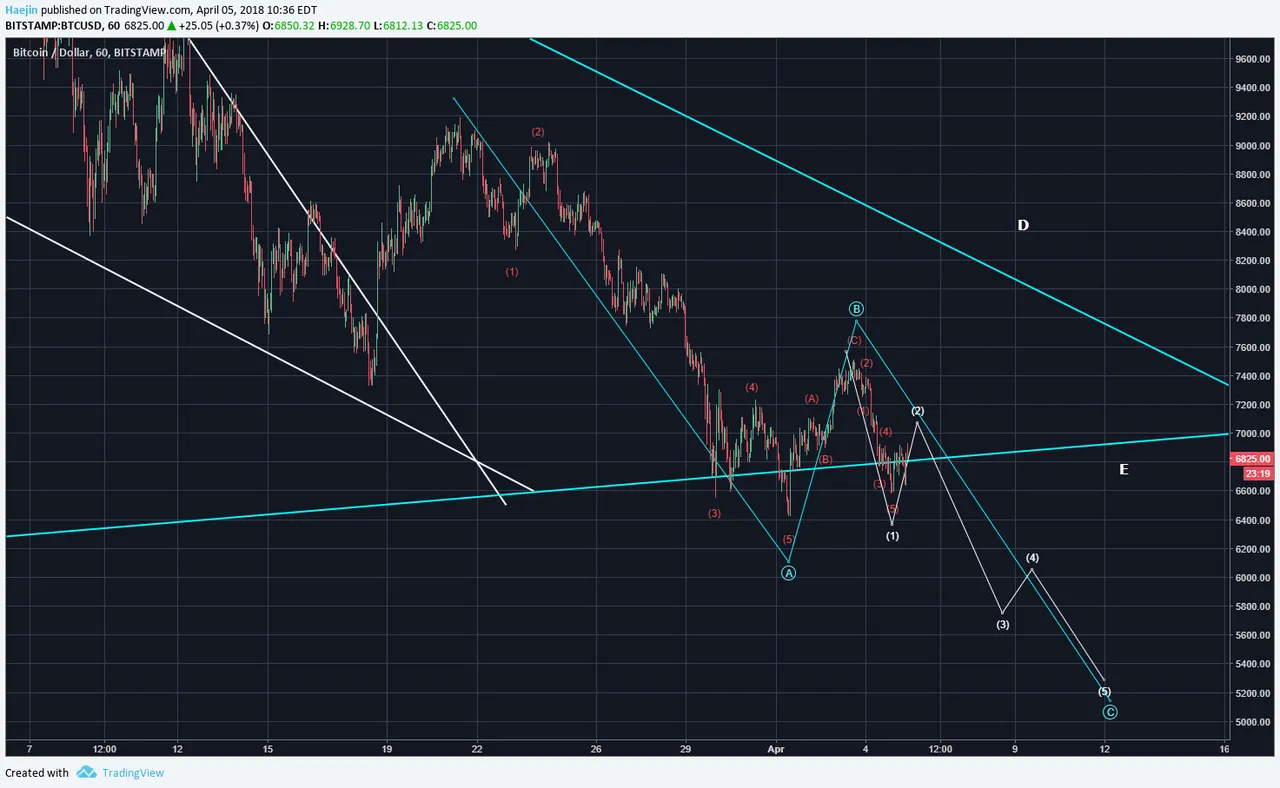
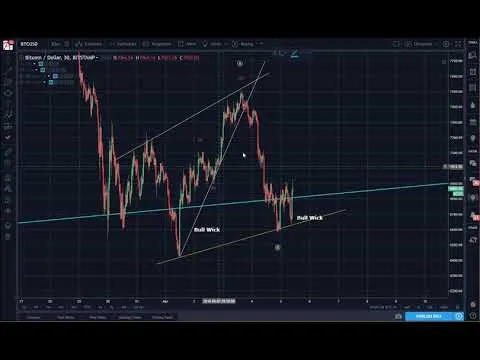
Here is a bit more on the alternate count which jives with the blue W bottom pathway. The chart shows a microwave count of what could be the final ABC (blue). Wave A has five distinct subwaves, B has distinct three abc waves and the final C could be generating its subwaves white 1, 2,3,4,5. Of these 1 is complete and the current bounce could be 2 which will be followed by the 3,4,5.
The above would fit into the below chart with the $5,120 bottom target zone.
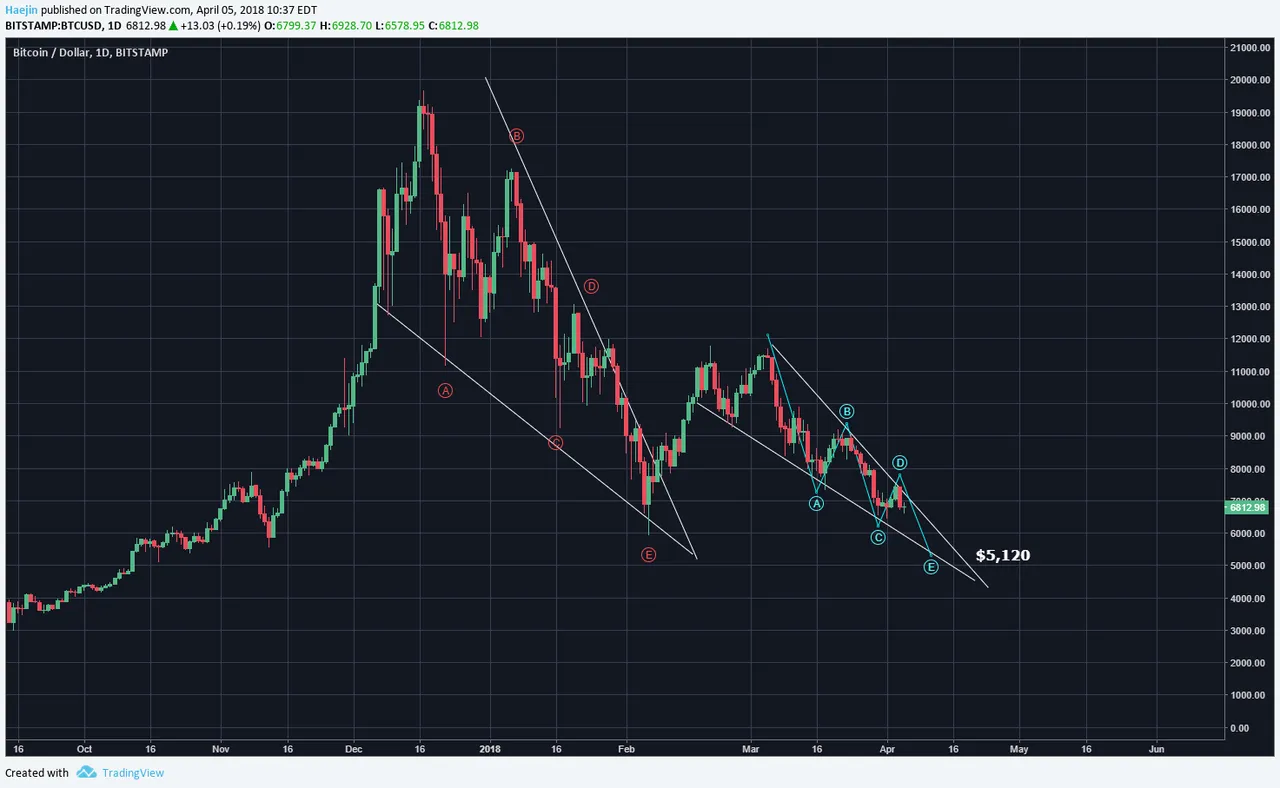
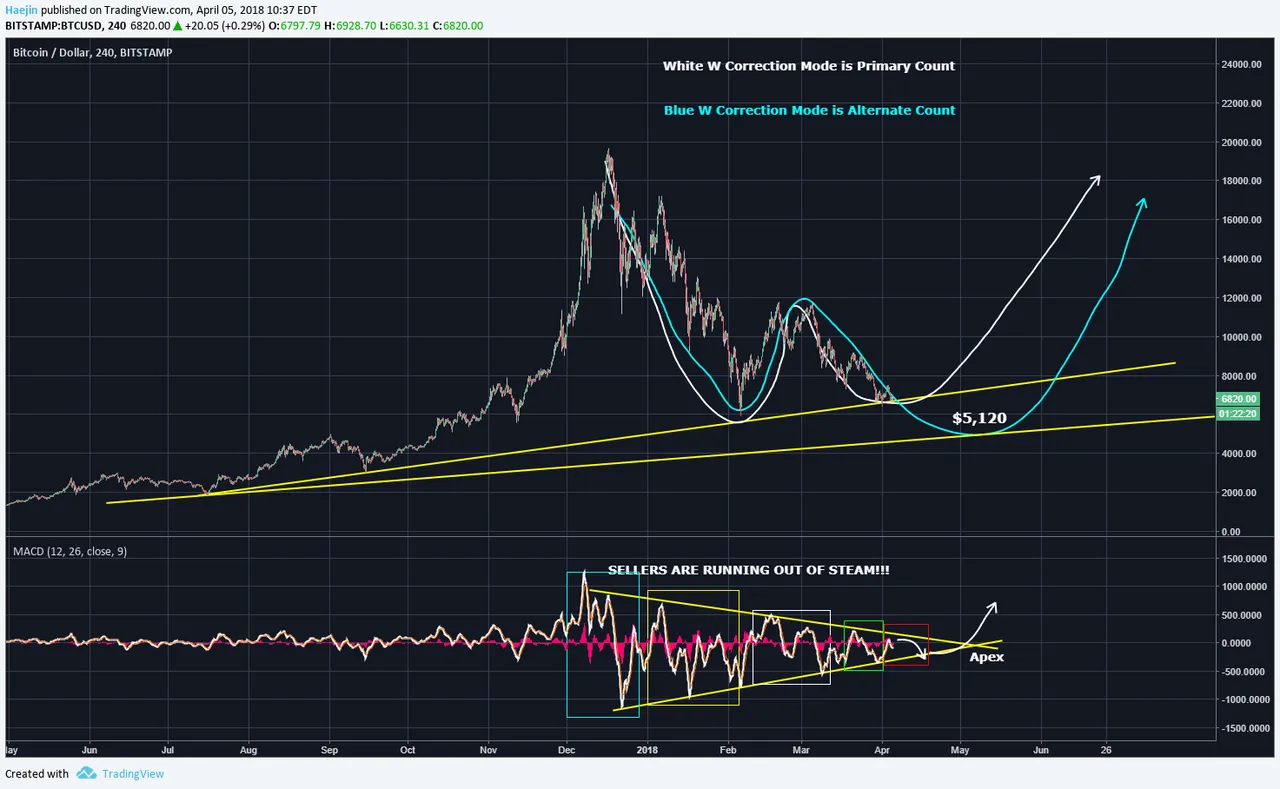
Regardless of the alternate, price still shows that its in the white W pathway and that still remains the primary.
Legal Disclaimer: I am not a financial advisor nor is any content in this article presented as financial advice. The information provided in this blog post and any other posts that I make and any accompanying material is for informational purposes only. It should not be considered financial or investment advice of any kind. One should consult with a financial or investment professional to determine what may be best for your individual needs. Plain English: This is only my opinion, make of it what you wish. What does this mean? It means it's not advice nor recommendation to either buy or sell anything! It's only meant for use as informative or entertainment purposes.
Please consider reviewing these Tutorials on:
Elliott Wave Counting Tutorial #1
Elliott Wave Counting Tutorial #2
Elliott Wave Counting Tutorial #3
Laddering and Buy/Sell Setups.
Laddering Example with EOS
Tutorial on the use of Fibonacci & Elliott Waves
@haejin's Trading Nuggets
Essay: Is Technical Analysis a Quantum Event?
Follow me on Twitter for Real Time Alerts!!
Follow me on StockTwits for UpDates!!
--
--

