
SUMMARY
An Analyst knows not the exact day or time of the pending breakout; but sees one coming by the confluence of pattern, Elliott Waves and indicator. I believe this breakout is only the early preamble of what's to come. Recall the Pop Corn Symphony metaphor I had used even back in late Summer when I was forecasting that a HUGE bull wave was coming. Well, yesterday we saw the EOS kernel pop, last week saw the STEEM and SBD kernels pop..soon there will be a crescendo of popping. I believe we will rally into July; many coins have new all time high potentials.
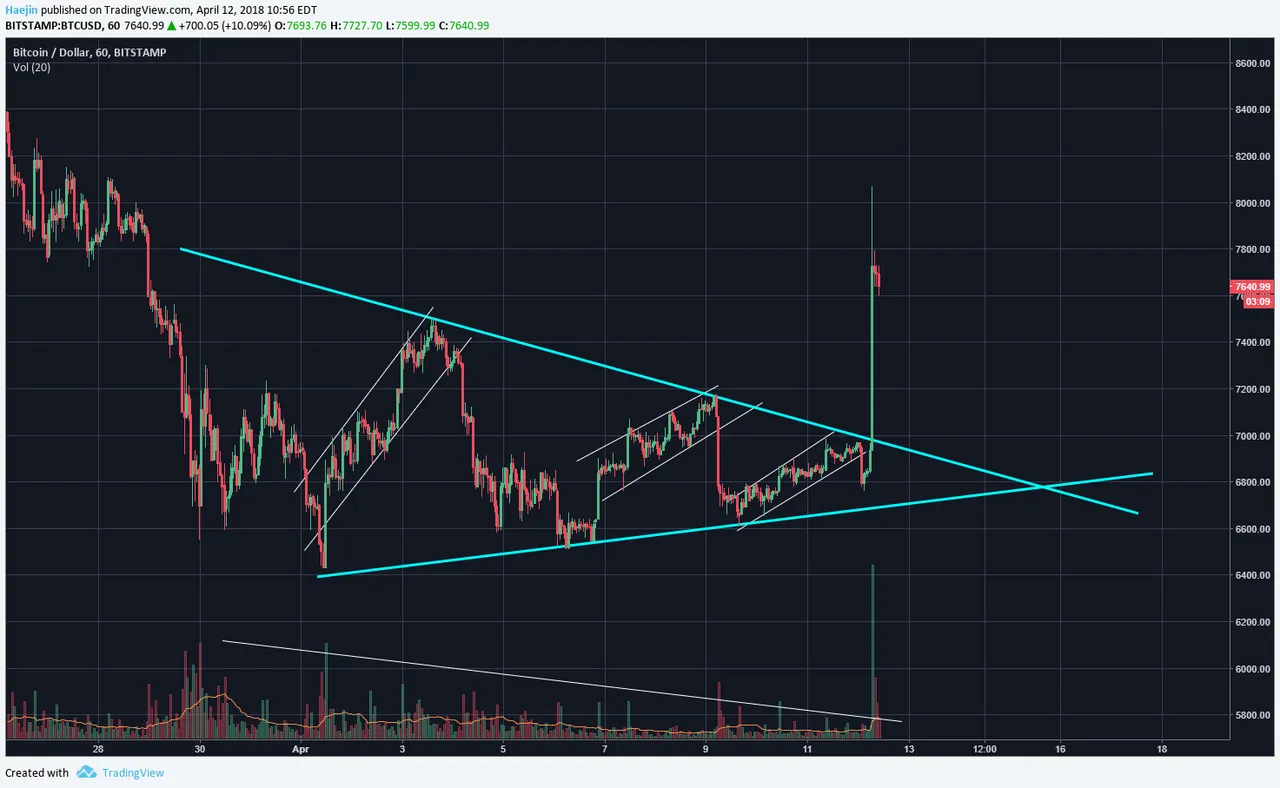
The below chart shows a prime example of how pattern and fractals show the sapping of seller strength. Note how the first bear flag generated the deepest decline while the second only a medium and the third only the minimal. The symmetrical pattern combined with declining volume showed that sellers were becoming an endangered species. The breakout has started so is this the time to be taking SELLING or BUYING actions?
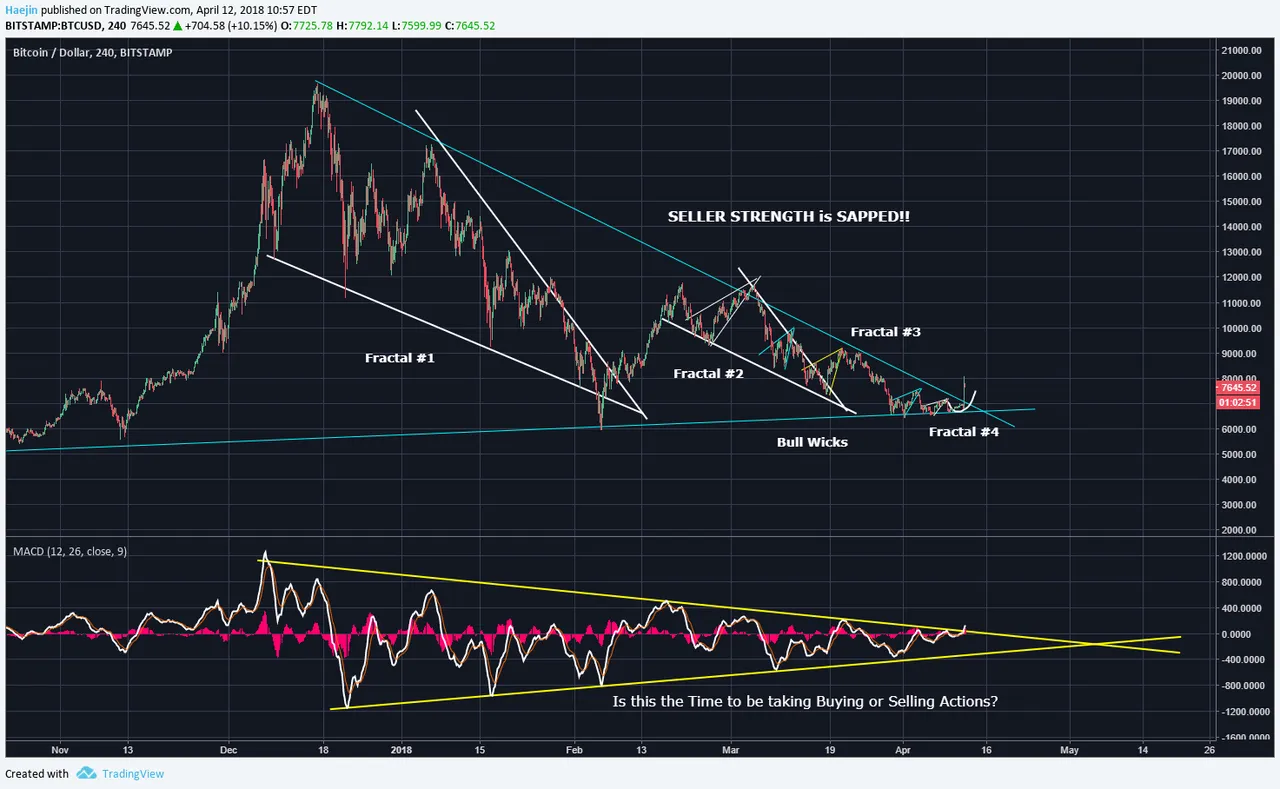
The long term picture also screams the same thing: SELLER STRENGTH is SAPPED!! The size of the wedge fractals, the degrees of decline from the upward pointing small wedges, proximity to the apex and the massively coiled MACD..all evidence that sellers are an endangered species. A MASSIVE short squeeze is in progress!
Legal Disclaimer: I am not a financial advisor nor is any content in this article presented as financial advice. The information provided in this blog post and any other posts that I make and any accompanying material is for informational purposes only. It should not be considered financial or investment advice of any kind. One should consult with a financial or investment professional to determine what may be best for your individual needs. Plain English: This is only my opinion, make of it what you wish. What does this mean? It means it's not advice nor recommendation to either buy or sell anything! It's only meant for use as informative or entertainment purposes.
Please consider reviewing these Tutorials on:
Elliott Wave Counting Tutorial #1
Elliott Wave Counting Tutorial #2
Elliott Wave Counting Tutorial #3
Laddering and Buy/Sell Setups.
Laddering Example with EOS
Tutorial on the use of Fibonacci & Elliott Waves
@haejin's Trading Nuggets
Essay: Is Technical Analysis a Quantum Event?
Follow me on Twitter for Real Time Alerts!!
Follow me on StockTwits for UpDates!!
--
--

