
SUMMARY
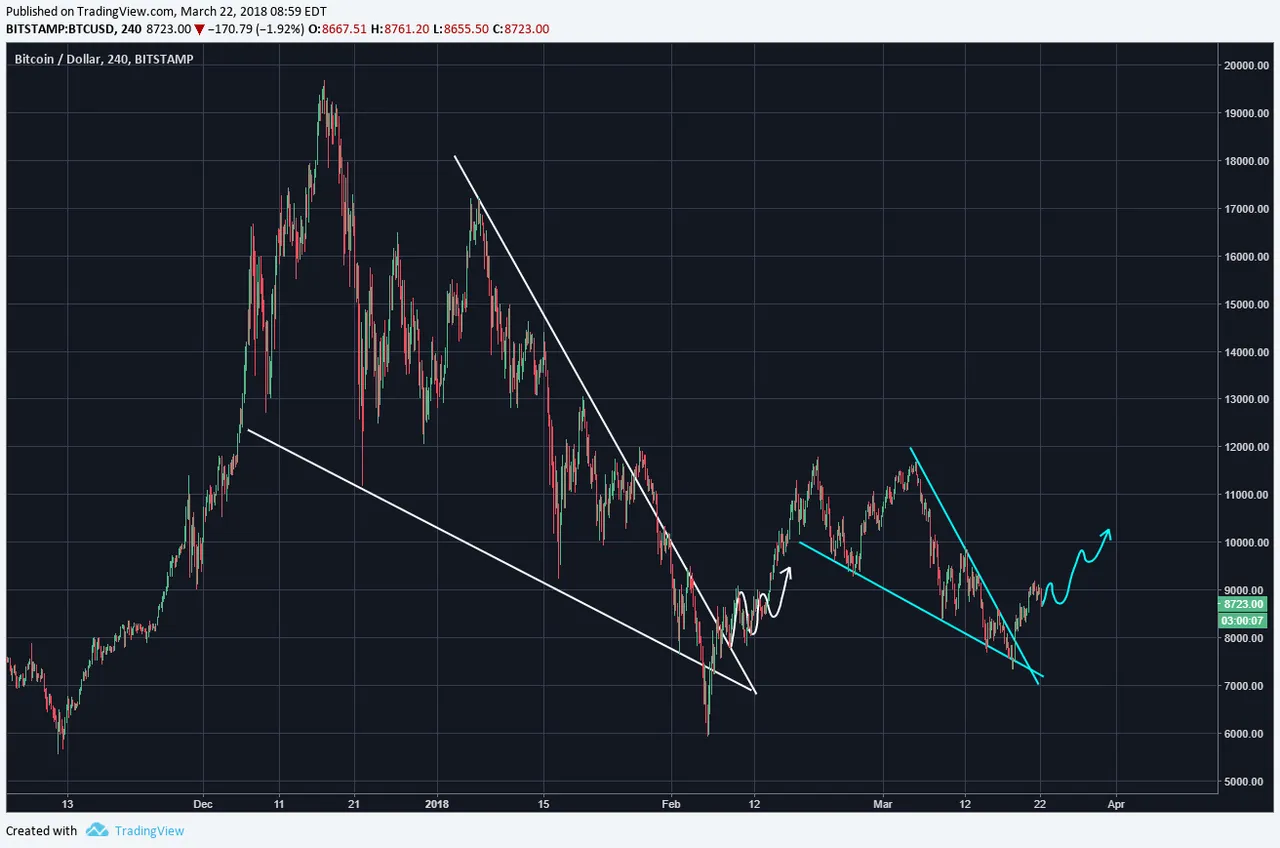
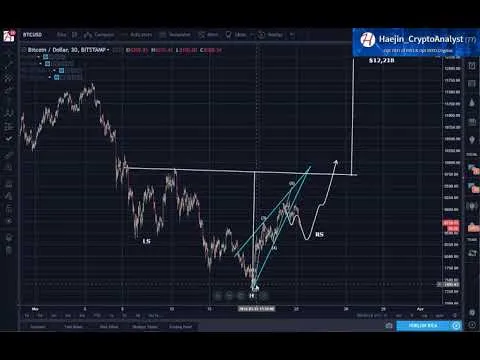
The below Bitcoin (BTC) charts show how multiple scenarios and pathways all jive well within a larger picture of price movement. First, the first of the two wedge fractals can be used as a guide for the future price pathway of the smaller one. The blue and white arrows indicate this application.
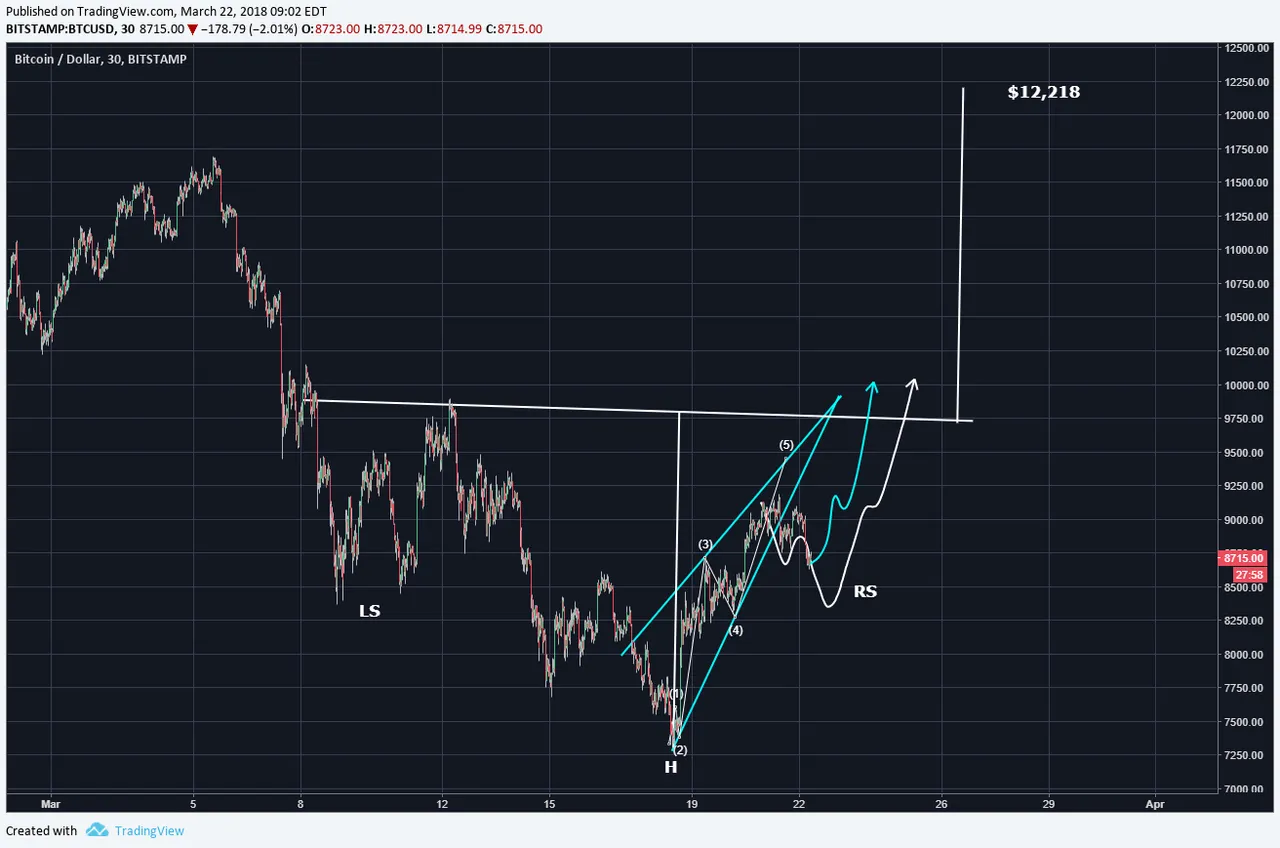
The IHS and wedge pattern jive well into the overall price movement as well. The RS can be formed in either the blue or the white pathways.
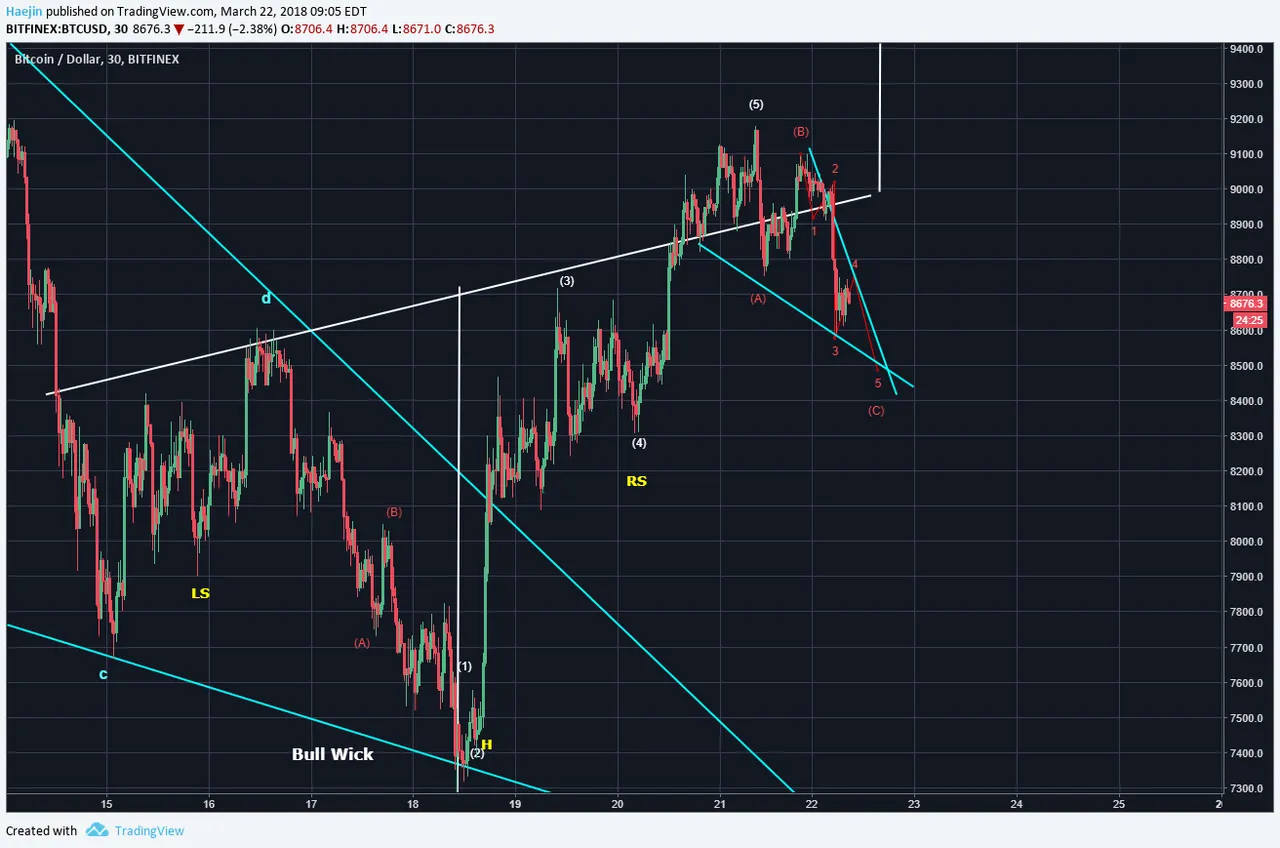
The five waves up indicate the threee wave correction which is currently in the process of finishing the C wave with its five subwaves of which red 1,2,3,4 are likely complete and 5 is in progress.
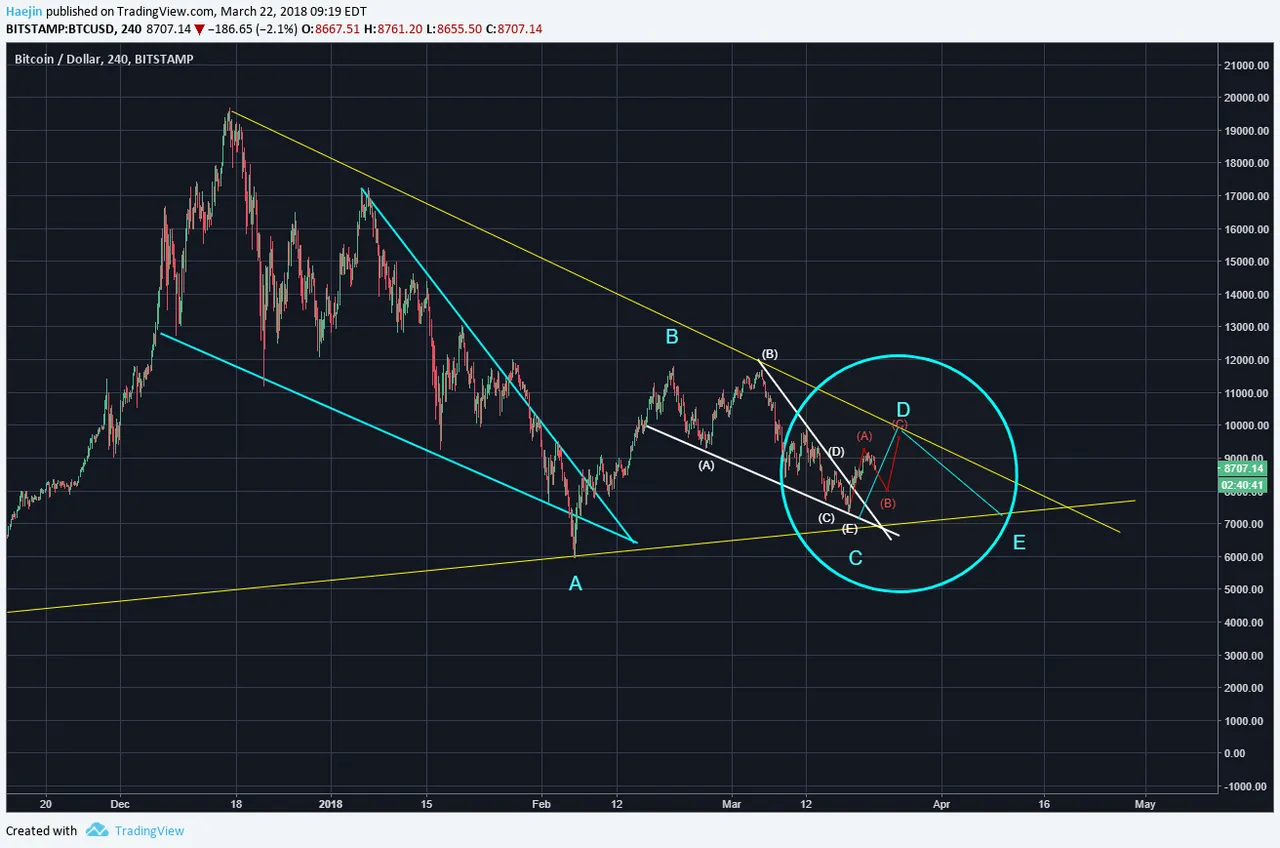
All of the above scenarios also jive and fit well within the larger picture of price moving in an ABCDE symmetrical triangle pattern. The circle highlights the current blue D wave and its three subwaves in action, red ABC.
Legal Disclaimer: I am not a financial advisor nor is any content in this article presented as financial advice. The information provided in this blog post and any other posts that I make and any accompanying material is for informational purposes only. It should not be considered financial or investment advice of any kind. One should consult with a financial or investment professional to determine what may be best for your individual needs. Plain English: This is only my opinion, make of it what you wish. What does this mean? It means it's not advice nor recommendation to either buy or sell anything! It's only meant for use as informative or entertainment purposes.
Please consider reviewing these Tutorials on:
Elliott Wave Counting Tutorial #1
Elliott Wave Counting Tutorial #2
Elliott Wave Counting Tutorial #3
Laddering and Buy/Sell Setups.
Laddering Example with EOS
Tutorial on the use of Fibonacci & Elliott Waves
@haejin's Trading Nuggets
Essay: Is Technical Analysis a Quantum Event?
Follow me on Twitter for Real Time Alerts!!
Follow me on StockTwits for UpDates!!
--
--

