
SUMMARY
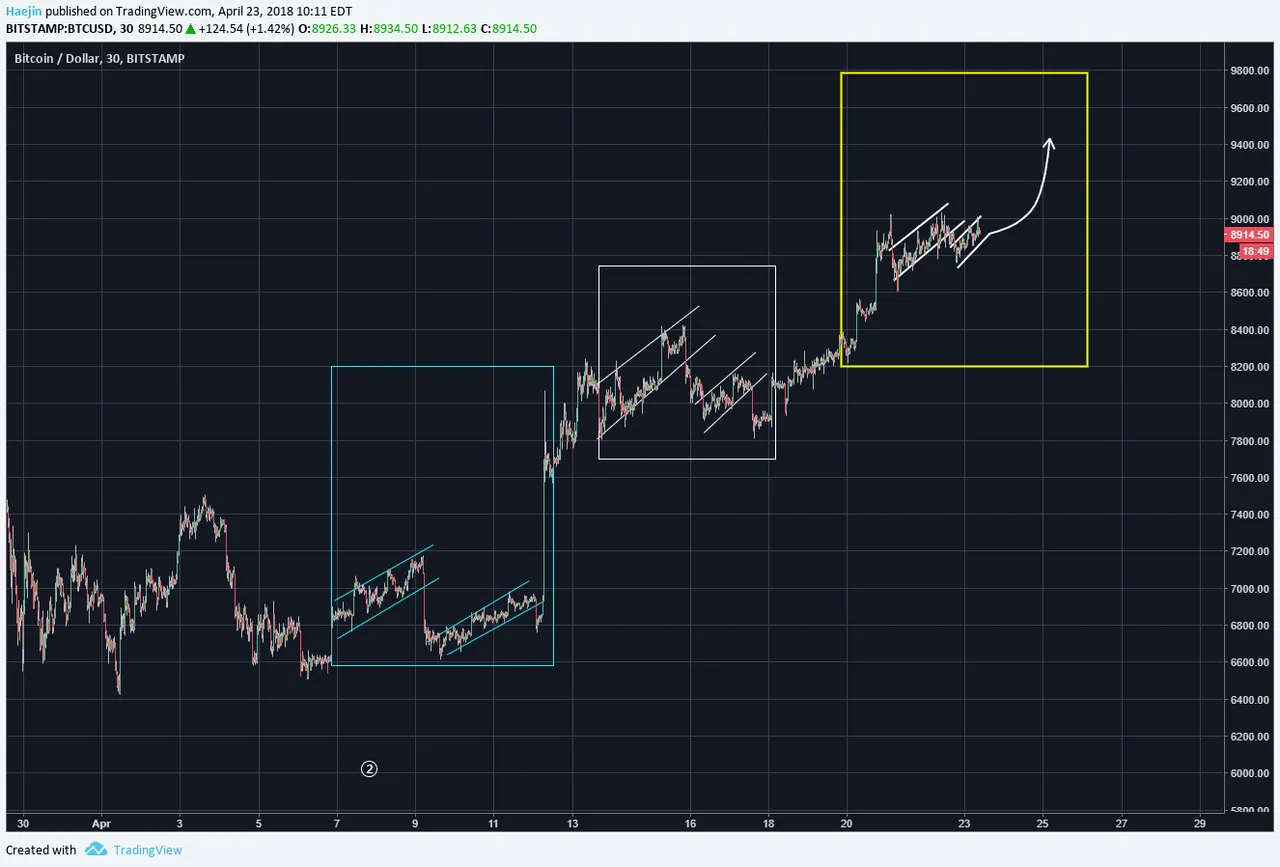
Bitcoin (BTC) could be deemed to have put in a third consequtive fractal as shown below (yellow box). The decline form the first flag was not as much as the prior two but he second flag was placed. I believe we should see higher highs in Bitcoin.
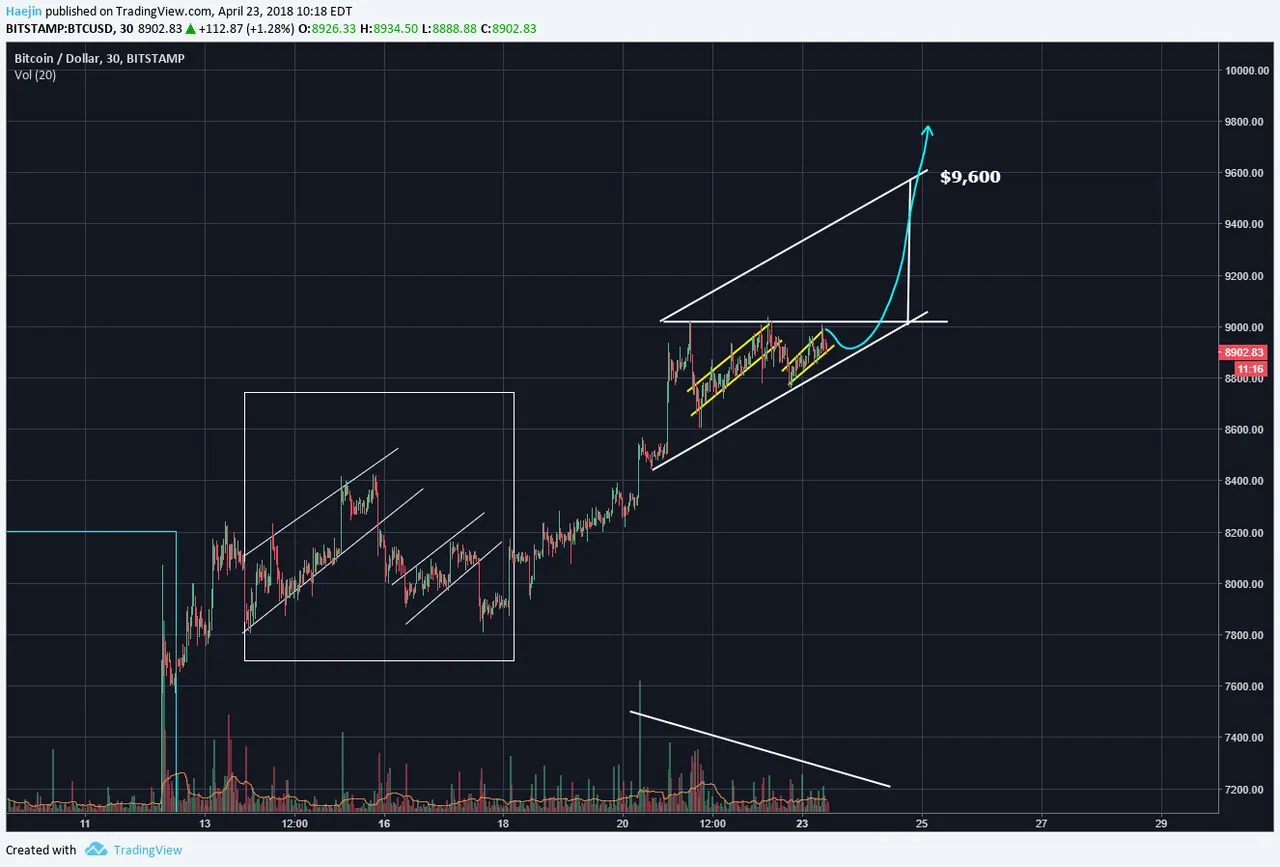
I've also drawn out the pattern of an ascending right triangle which consists of a horizontal and an ascending line. What's attractive is how the fractal is embedded within this pattern; hence more bullish! Ascending right triangles appearing at mid point of an ascent act as continuation signals. The minimum price run for this pattern is $9,600 or $10k.

Legal Disclaimer: I am not a financial advisor nor is any content in this article presented as financial advice. The information provided in this blog post and any other posts that I make and any accompanying material is for informational purposes only. It should not be considered financial or investment advice of any kind. One should consult with a financial or investment professional to determine what may be best for your individual needs. Plain English: This is only my opinion, make of it what you wish. What does this mean? It means it's not advice nor recommendation to either buy or sell anything! It's only meant for use as informative or entertainment purposes.
Please consider reviewing these Tutorials on:
Elliott Wave Counting Tutorial #1
Elliott Wave Counting Tutorial #2
Elliott Wave Counting Tutorial #3
Laddering and Buy/Sell Setups.
Laddering Example with EOS
Tutorial on the use of Fibonacci & Elliott Waves
@haejin's Trading Nuggets
Essay: Is Technical Analysis a Quantum Event?
Follow me on Twitter for Real Time Alerts!!
Follow me on StockTwits for UpDates!!
--
--

