
SUMMARY
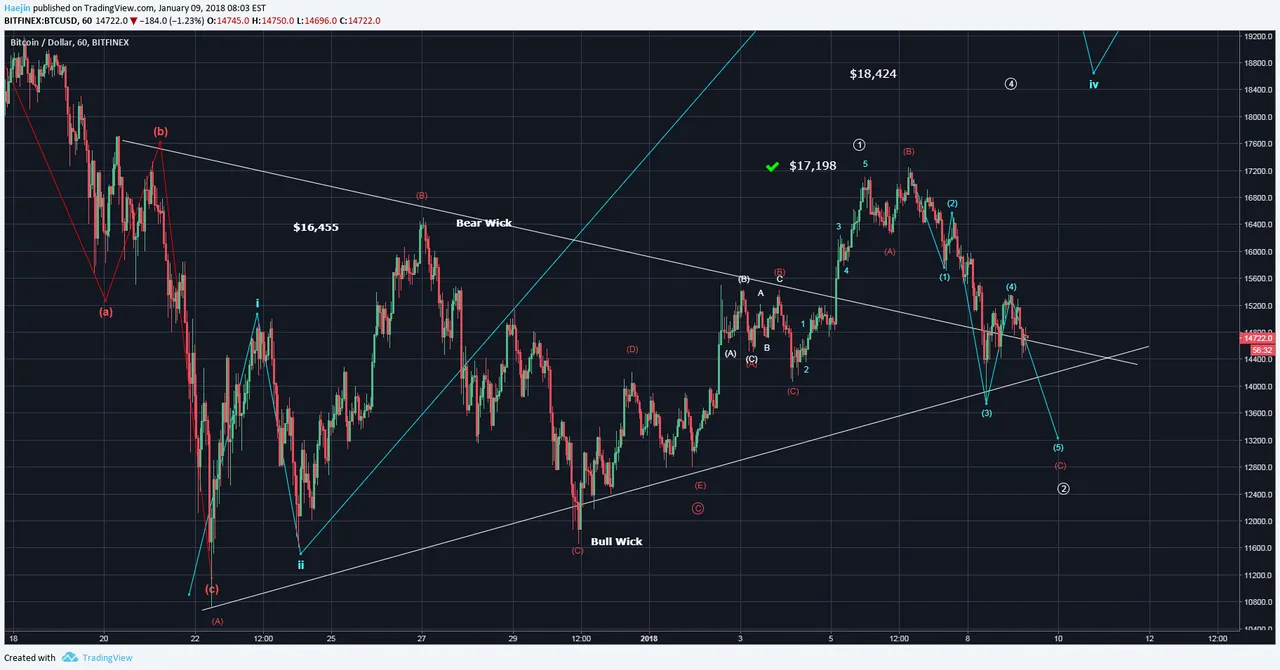
Bitcoin (BTC) overnight price action likely completed wave 4 of a five wave decline for a higher degree of trend red wave C as shown in below chart. I'm using the expanded flat a,b,c waves as the guide to this correction. The blue waves are composing the completion of the c wave of the expanded a,b,c.
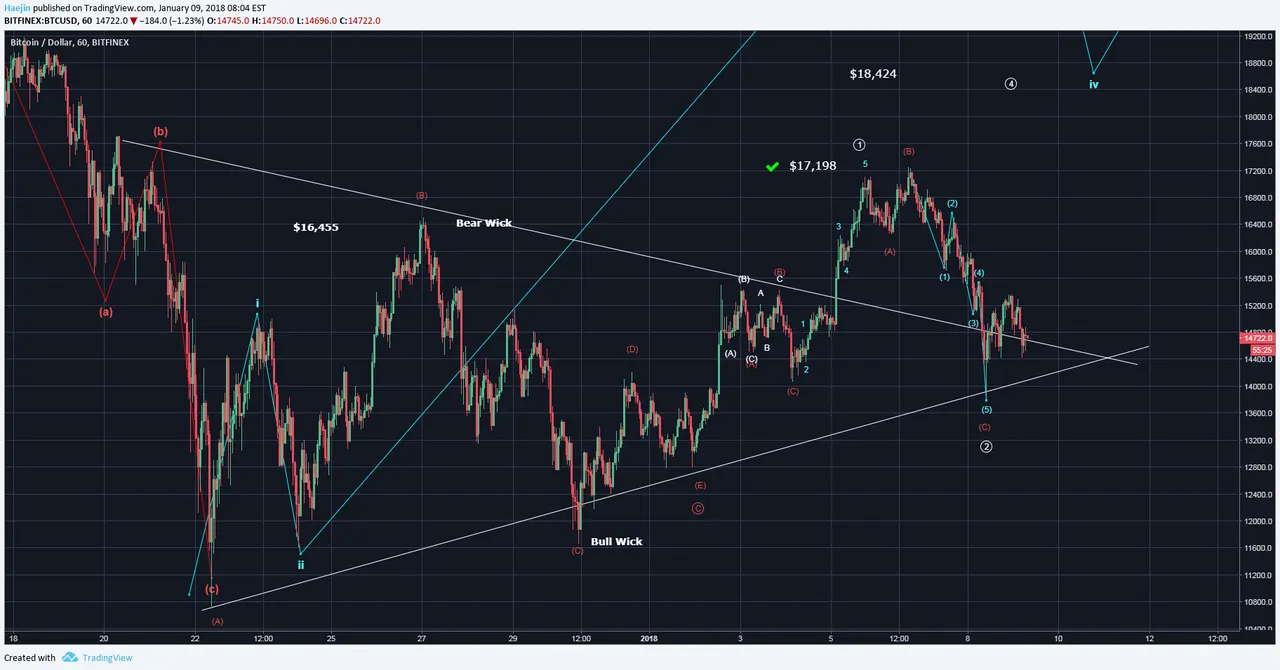
Now, there is a scenario and count where the five waves could be done as shown below. This count is technically correct for five waves down of a c wave. However, the subsequent waves are very three wavish. More importantly the last chart shows additional reason why there is likely one more lower low.
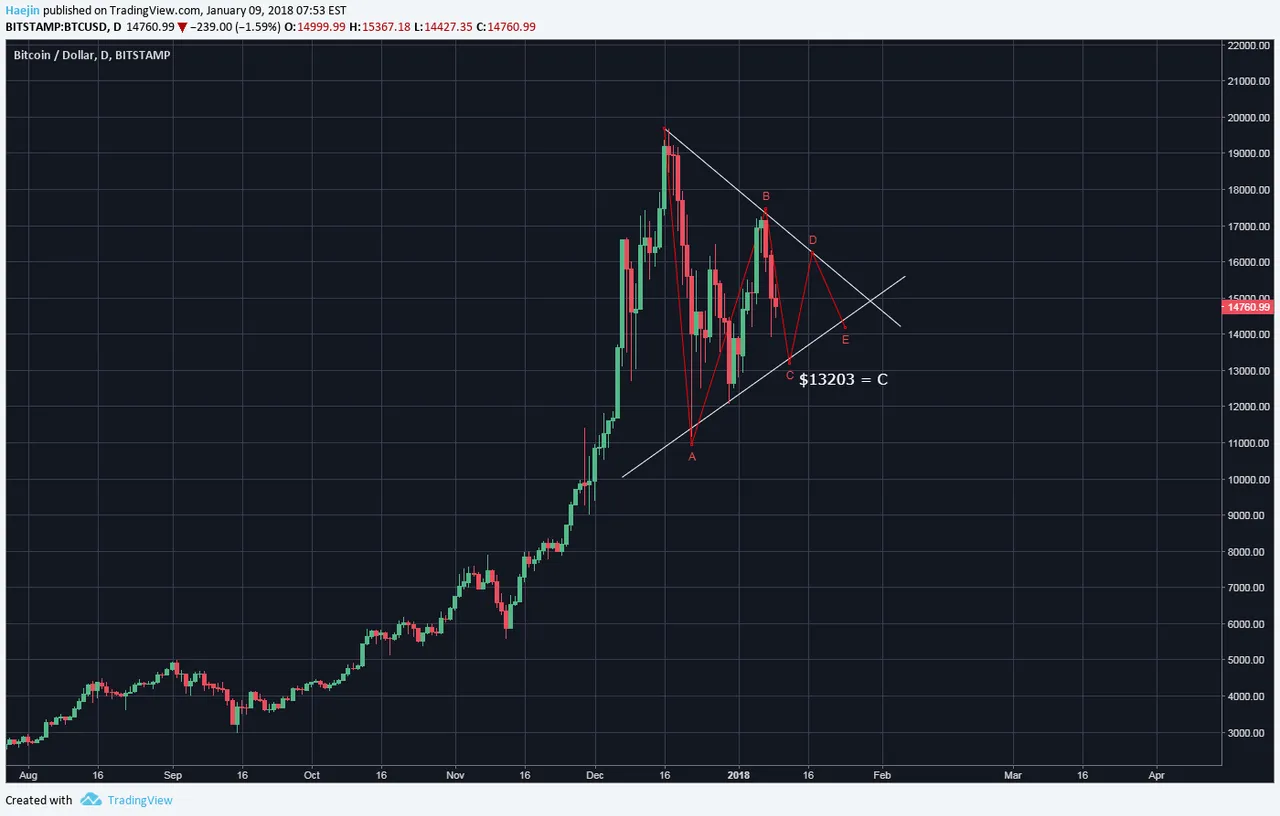
I want to thank @dbrdr for sharing the below chart pattern. Well done! It shows that an a,b,c,d,e could be in progress. IF that's the case, then it lends to wave C going to around $13,203 or so. That also jives well with the one more lower low requirement of the above first chart. Let's see what happens during the day time price action.
Please consider reviewing these Tutorials on:
Elliott Wave Counting Tutorial #1
Elliott Wave Counting Tutorial #2
Elliott Wave Counting Tutorial #3
Laddering and Buy/Sell Setups.
Laddering Example with EOS
Tutorial on the use of Fibonacci & Elliott Waves
These Technical Analysis Books: Elliott Wave Priniciple & Technical Analysis of Stock Trends are highly recommended
@haejin's Trading Nuggets
Essay: Is Technical Analysis a Quantum Event?
Follow me on Twitter for Real Time Alerts!!
Follow me on StockTwits for UpDates!!
--
--

If this blog post has entertained or helped you to profit, please follow, upvote, resteem and/or consider buying me a beer:
BTS Wallet - haejin1970
BTC Wallet - 1HMFpq4tC7a2acpjD45hCT4WqPNHXcqpof
ETH Wallet - 0x1Ab87962dD59BBfFe33819772C950F0B38554030
LTC Wallet - LecCNCzkt4vjVq2i3bgYiebmr9GbYo6FQf

Legal Disclaimer: This is only my opinion, make of it what you wish. What does this mean? It means it's not advice nor recommendation to either buy or sell anything! It's only meant for use as informative or entertainment purposes.**