
SUMMARY
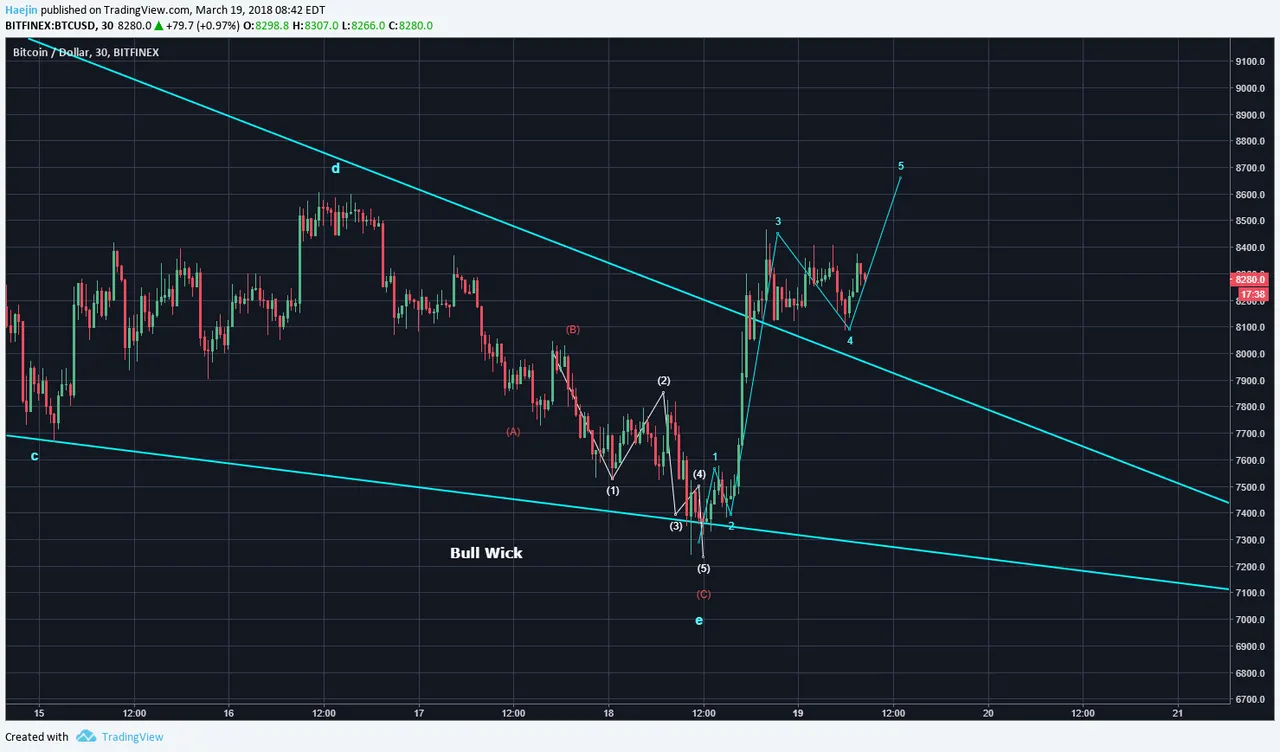
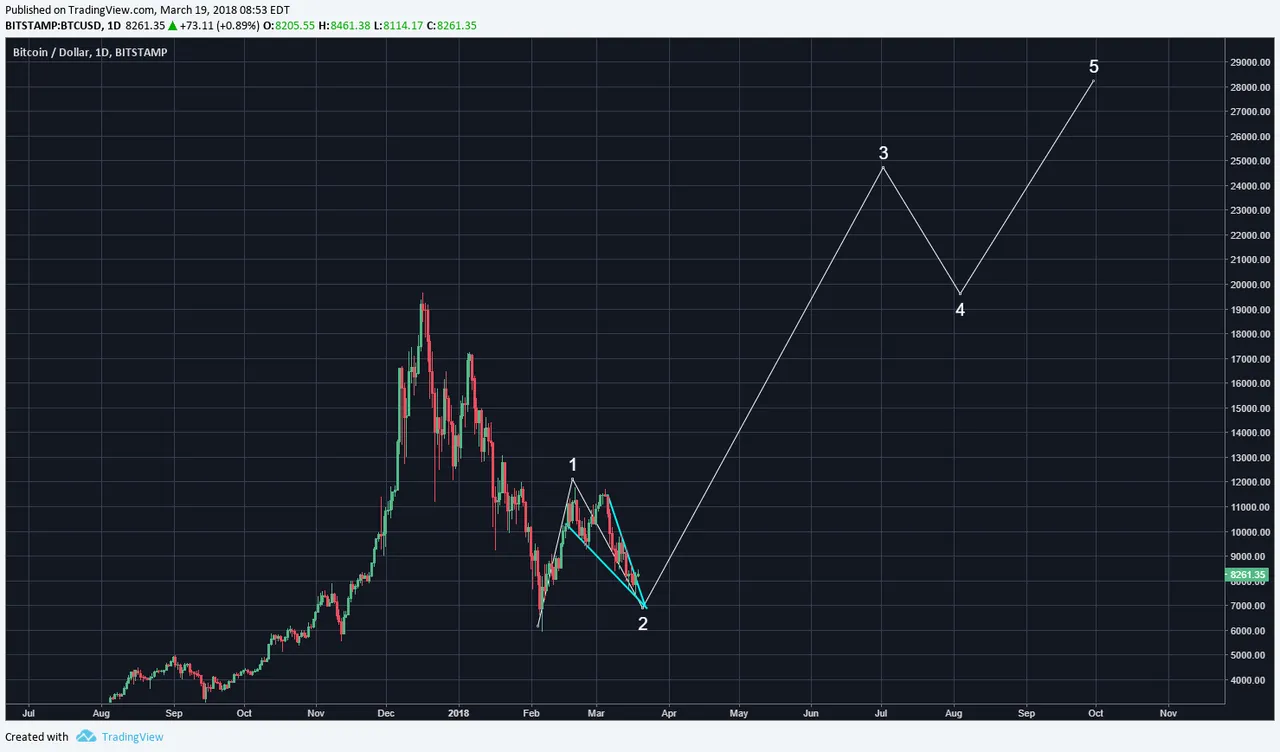
Bitcoin (BTC) overnight price action has it so that price still remains above the upper blue line of the wedge pattern it broke out of. The blue waves show on version of an impulse motive up. For any trend reversal, the earliest sign of it is an full impulse motive and the blue waves are trying to show that pathway.
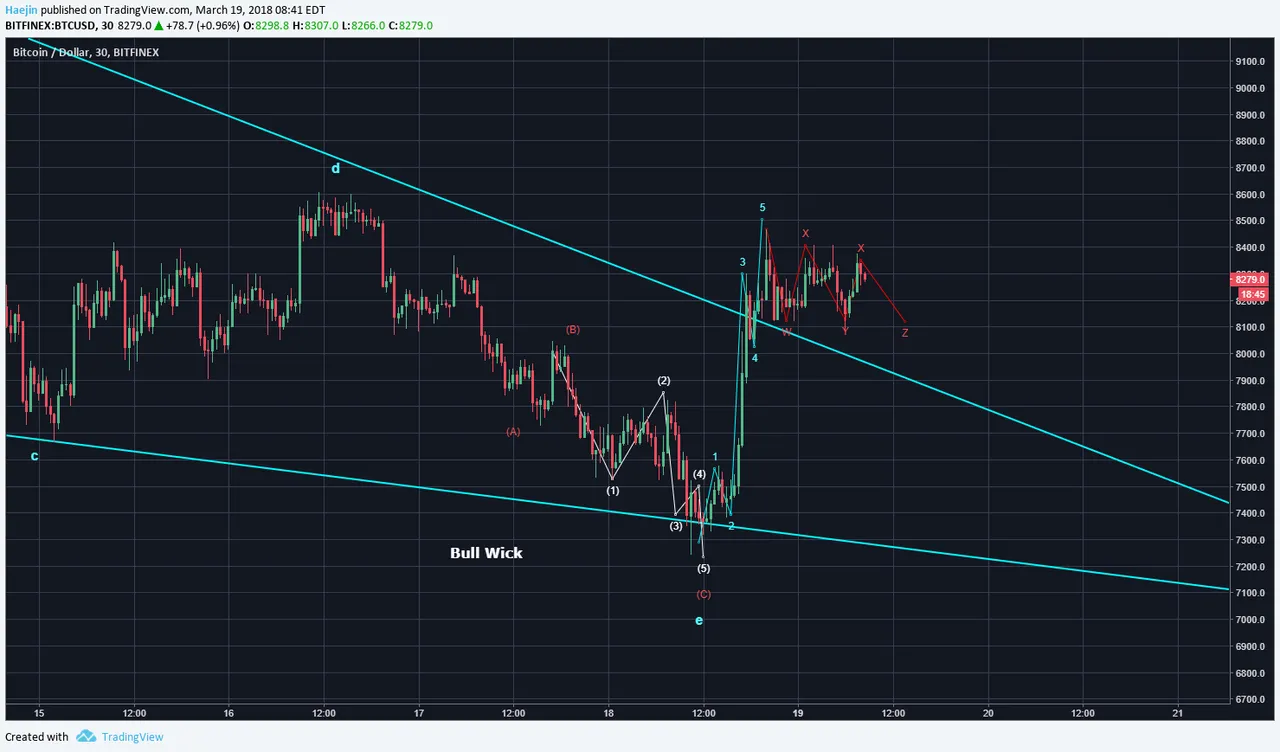
The other version is that the five blues are complete and there is a minor wxyxz sideways correction in progress before a second round of impulse is initiated. If so, this would be bullish.
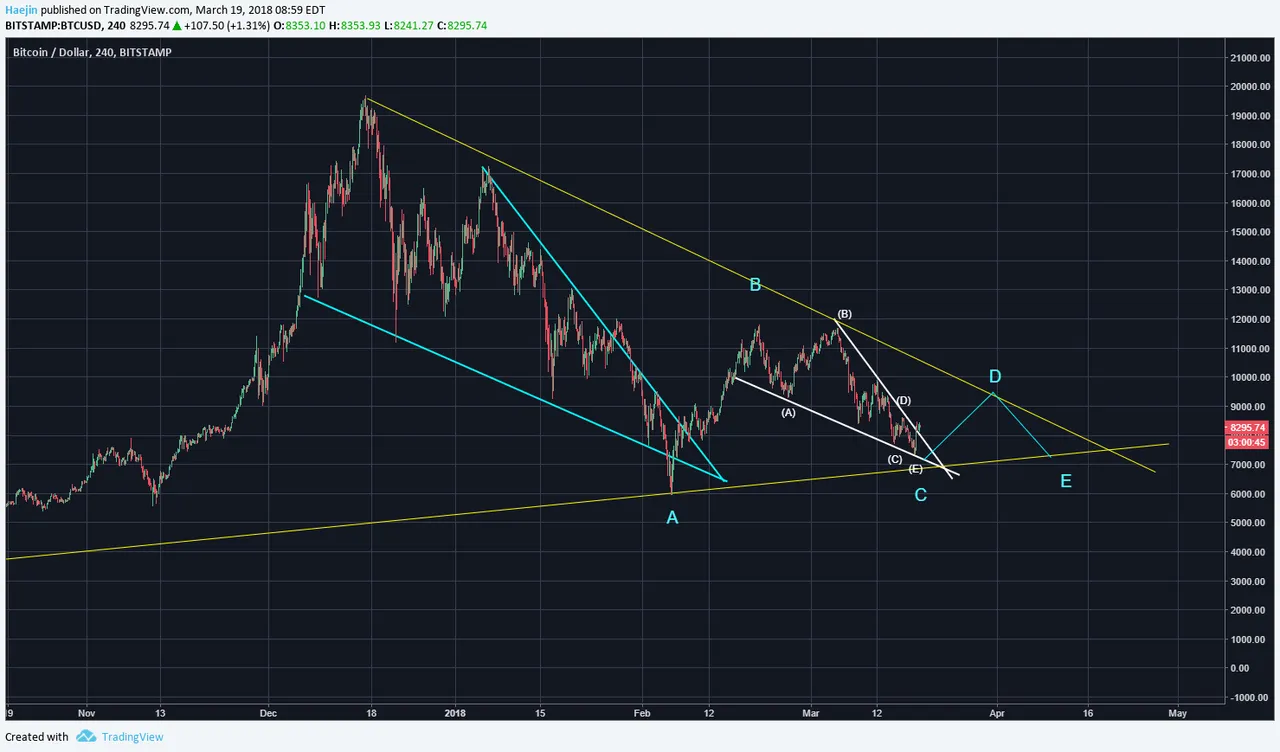
The longer term picture of an abcde (blue) has it so that blue wave D could have been initiated.
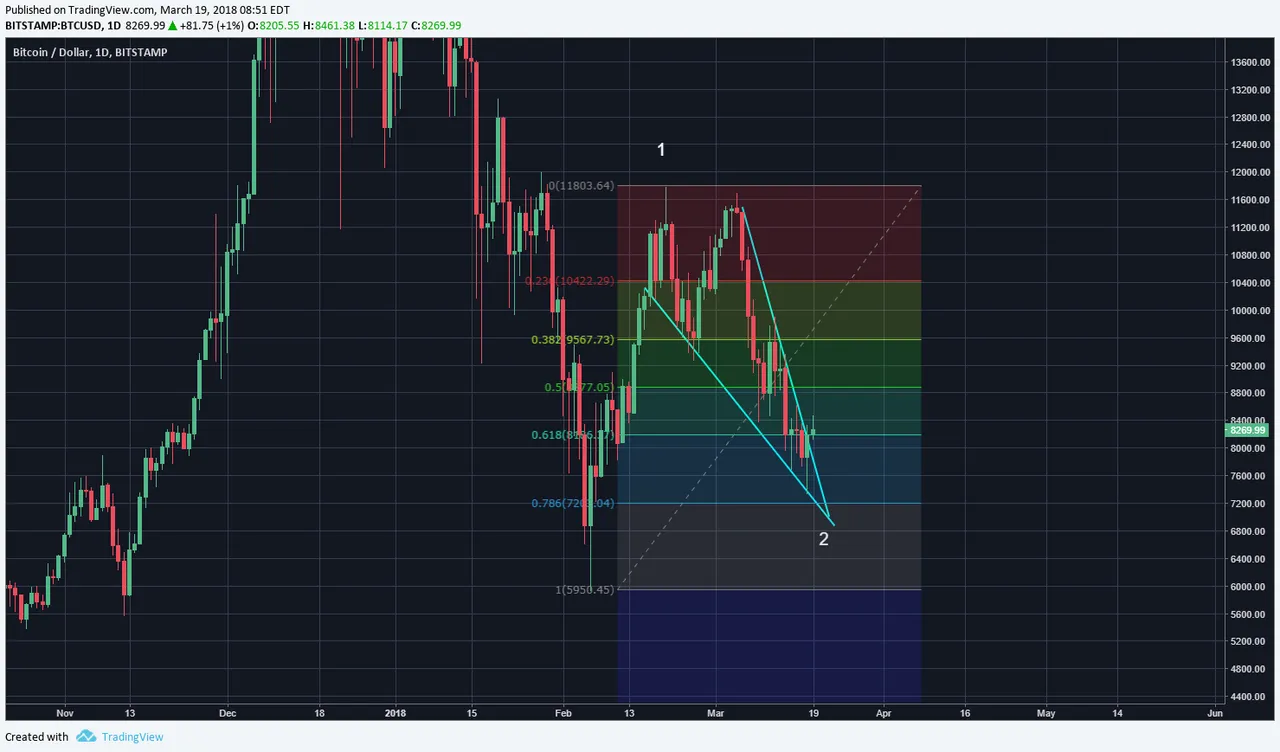
The retracement was about 0.78 Fibonacci and note the white wave 1 and 2. That count has not been invalidated and this was discussed a couple weeks ago, before the minor correction of white wave 2 started. So, if white wave 2 is complete, which wave is next? Wave 3 and it's usually the most violent in its moves.
So, here again is the same longer term impulse count showing how the white waves 1 and 2 fit into the future potential targets and timeline. This would be made more likely IF price decides NOT to complete the longer term blue E wave in the symmetrical triangle and price decides to breakout at the blue D. Both are converging to a decision point and either way, it could be quite bullish.
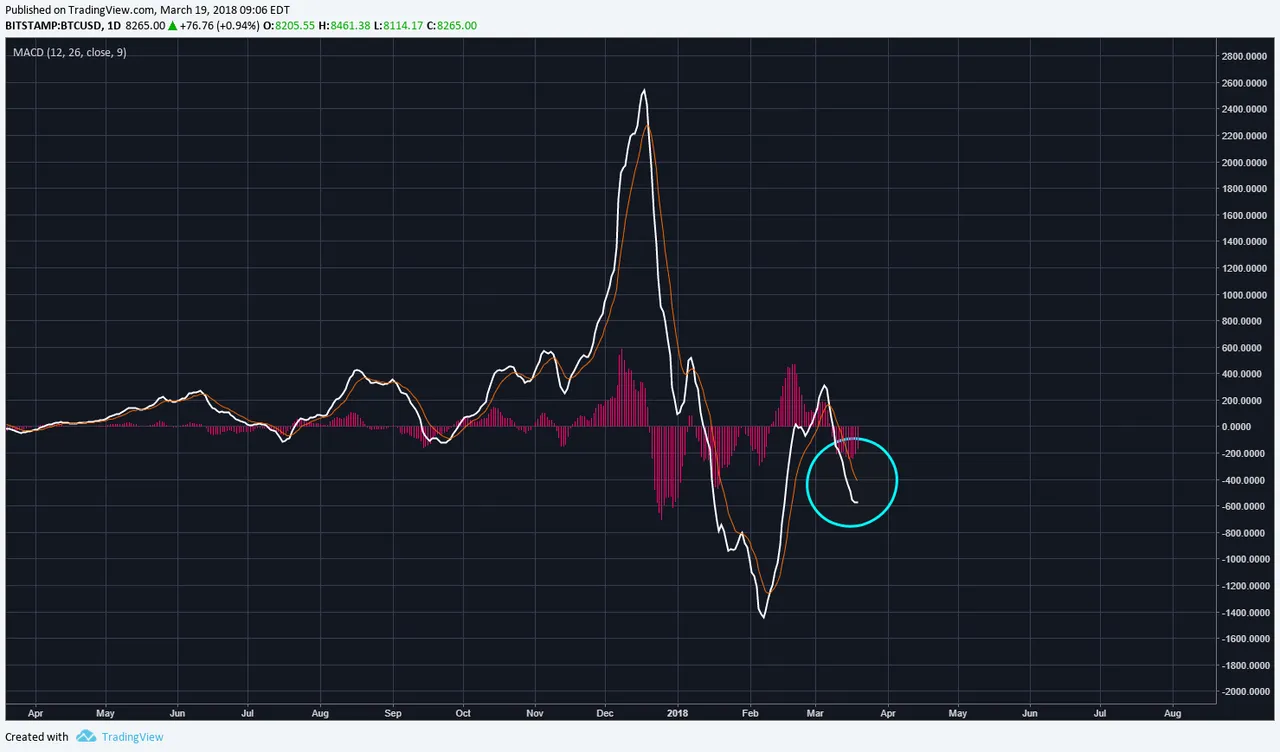
Here is the daily MACD where the white 12 day indicator continues to curl upwards:
Legal Disclaimer: I am not a financial advisor nor is any content in this article presented as financial advice. The information provided in this blog post and any other posts that I make and any accompanying material is for informational purposes only. It should not be considered financial or investment advice of any kind. One should consult with a financial or investment professional to determine what may be best for your individual needs. Plain English: This is only my opinion, make of it what you wish. What does this mean? It means it's not advice nor recommendation to either buy or sell anything! It's only meant for use as informative or entertainment purposes.
Please consider reviewing these Tutorials on:
Elliott Wave Counting Tutorial #1
Elliott Wave Counting Tutorial #2
Elliott Wave Counting Tutorial #3
Laddering and Buy/Sell Setups.
Laddering Example with EOS
Tutorial on the use of Fibonacci & Elliott Waves
@haejin's Trading Nuggets
Essay: Is Technical Analysis a Quantum Event?
Follow me on Twitter for Real Time Alerts!!
Follow me on StockTwits for UpDates!!
--
--

