SUMMARY
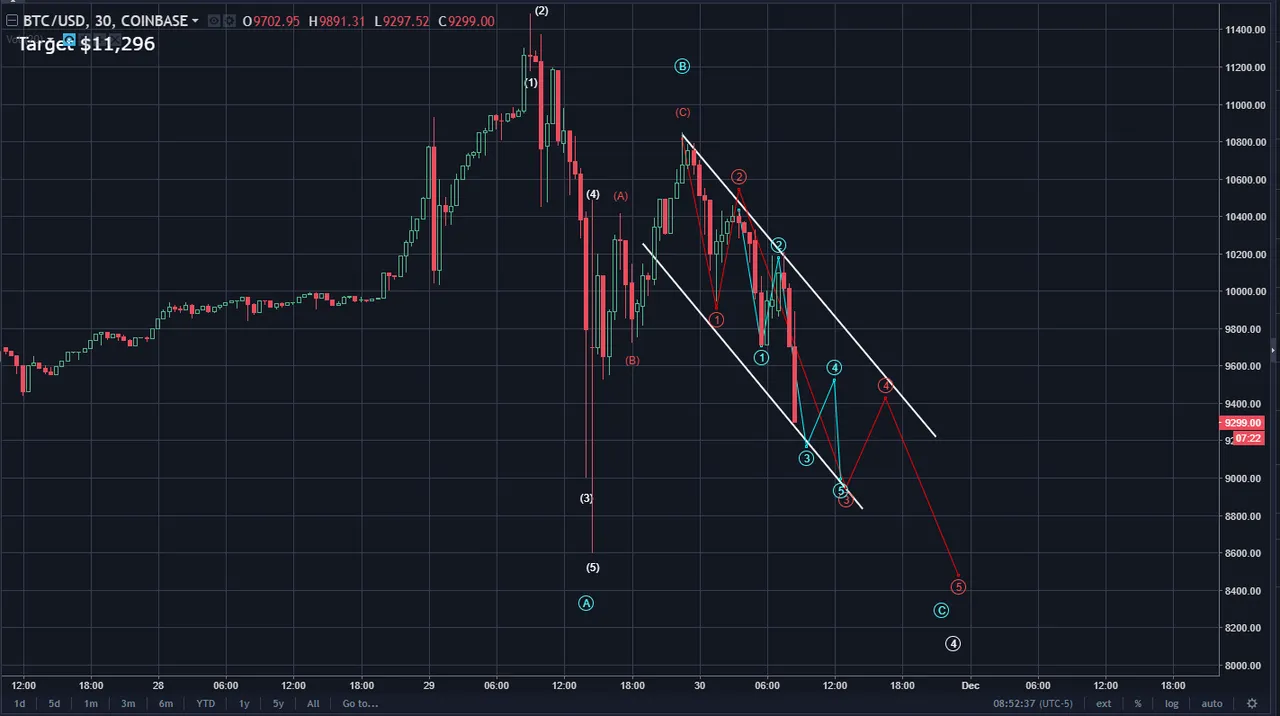
Bitcoin (BTC) overnight price action has revealed more evidence that this is a correction. As shown below, the blue b wave consists of clear three sub waves. Therefore, further evidence is given to show this is a 5,3,5 zig zag a,b,c retracement. I've added the final five waves of the blue wave c. Also labeled the subwaves of wave 3 of blue c. So when is the best time to BTFD? At the terminal end of an a,b,c correction. So, once price goes lower than blue A wave, consider BTFD.
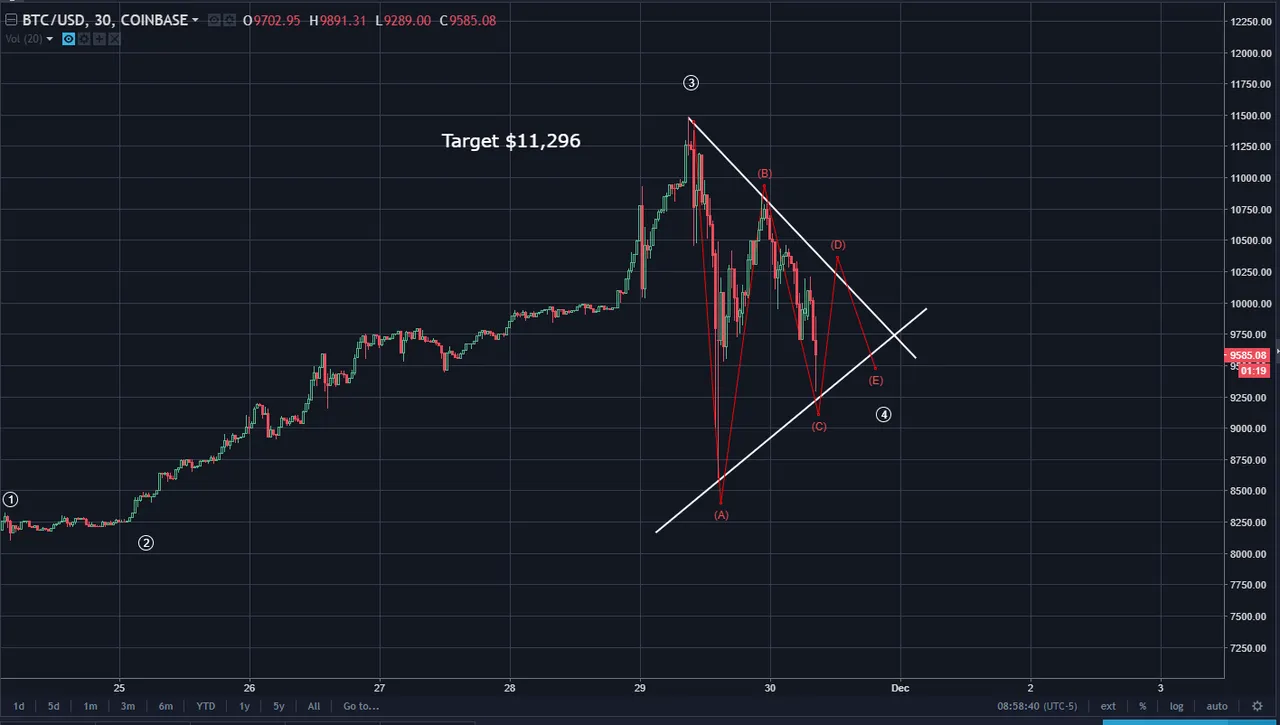
The algorithmic power of combining Elliott Waves and Chart Patterns is immeasurable! Below is a probable pattern outcome for Bitcoin as an a,b,c,d,e symmetrical triangle.
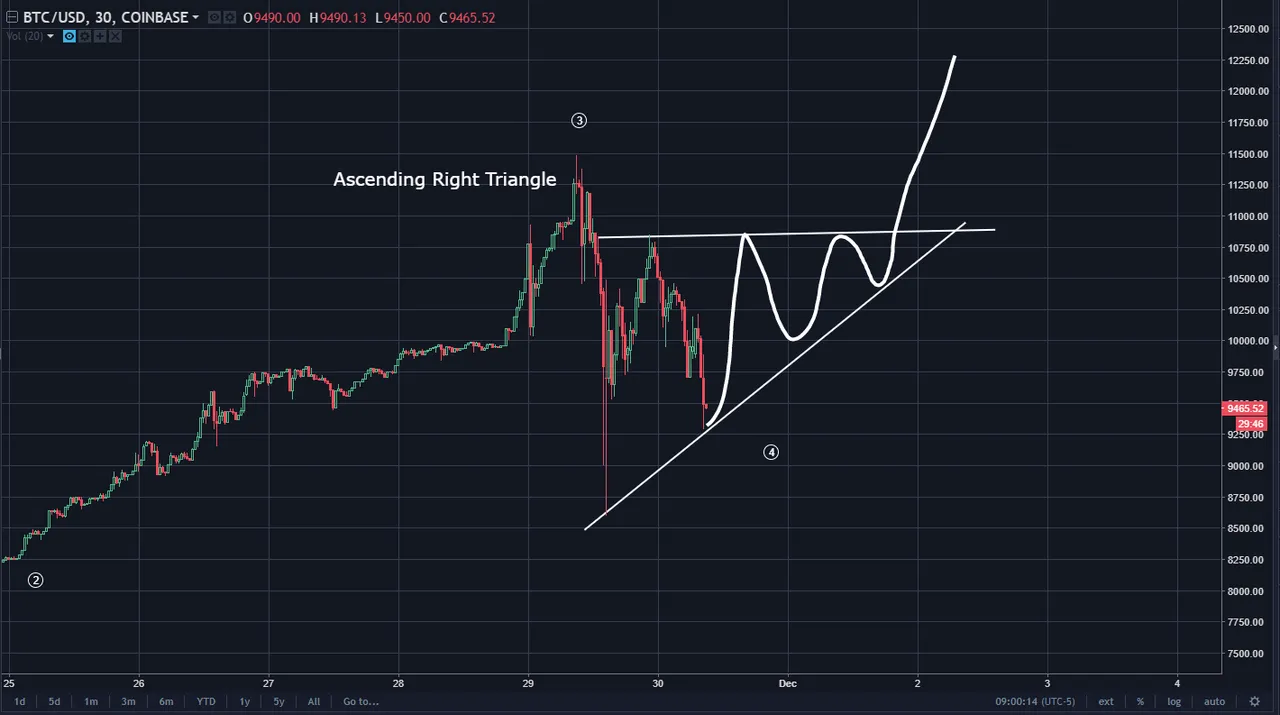
Another likely patter outcome is a bullish ascending right triangle as shown below.
The video has lots more details regarding Centralized Exchanges vs De-Centralized Exchanges you might want to hear:
Please consider reviewing these Tutorials on:
Elliott Wave Counting Tutorial #1
Elliott Wave Counting Tutorial #2
Elliott Wave Counting Tutorial #3
Laddering and Buy/Sell Setups.
Laddering Example with EOS
Tutorial on the use of Fibonacci & Elliott Waves
These Technical Analysis Books: Elliott Wave Priniciple & Technical Analysis of Stock Trends are highly recommended
@haejin's Trading Nuggets
Essay: Is Technical Analysis a Quantum Event?
Follow me on Twitter for Real Time Alerts!!
--

If this blog post has entertained or helped you to profit, please follow, upvote, resteem and/or consider buying me a beer:
BTS Wallet - haejin1970
BTC Wallet - 1HMFpq4tC7a2acpjD45hCT4WqPNHXcqpof
ETH Wallet - 0x1Ab87962dD59BBfFe33819772C950F0B38554030
LTC Wallet - LecCNCzkt4vjVq2i3bgYiebmr9GbYo6FQf

Legal Mumbo Jumbo: This is only my opinion, make of it what you wish. What does this mean? It means it's not advice nor recommendation to either buy or sell anything! It's only meant for use as informative or entertainment purposes.**