
SUMMARY
Bitcoin (BTC) remains above the long term support line. Yesterday say a mutli price bar dip below it; but a surging green bar took prices back above the support. The below chart shows a white arrow line that outlines a potential multi support piercing; almost as a needle and a thread to sow up the tear on the support! The MACD had touched the lower yellow support line and has started rising towards the upper yellow resistance. The apex for both price and MACD are both fast approaching. What does this mean? It means that the Sellers are running out of time! They need to give all they've got to bring Bitcoin to a lower low on a daily scale and yet, they have two problems: Declining seller population and much narrower MACD mobility. There just may not be enough sellers to destroy Bitcoin's price. The MACD has been obeying the contracting yellow lines since December and currently, the vertical mobility is extremely limited and that means price mobility is also very limited. The MACD has been making higher lows while price has been making lower lows; a positive divergence that goes against the Sellers' efforts.
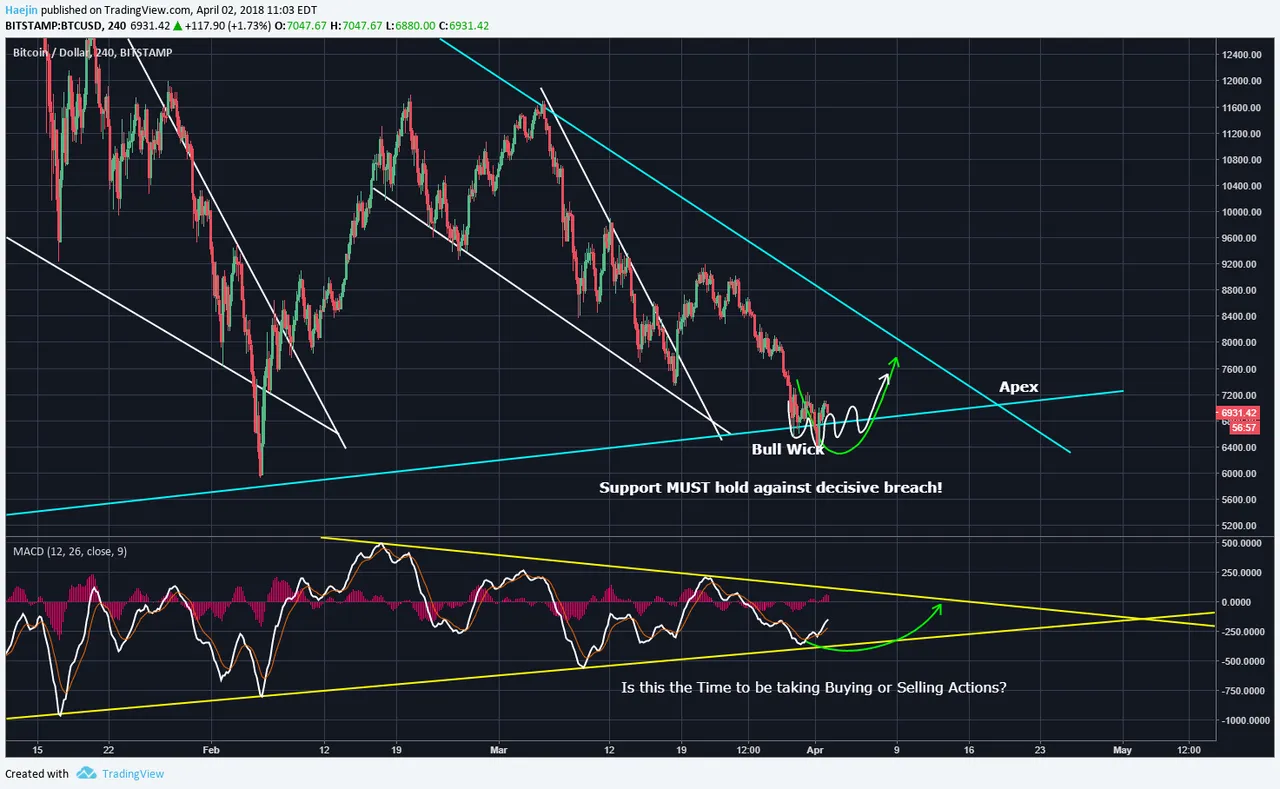
The W bottoming process is still preferring the white pathway as the long term support has held up pretty well, so far. The MACD also confirms that a resolution of direction is fast approaching.
Legal Disclaimer: I am not a financial advisor nor is any content in this article presented as financial advice. The information provided in this blog post and any other posts that I make and any accompanying material is for informational purposes only. It should not be considered financial or investment advice of any kind. One should consult with a financial or investment professional to determine what may be best for your individual needs. Plain English: This is only my opinion, make of it what you wish. What does this mean? It means it's not advice nor recommendation to either buy or sell anything! It's only meant for use as informative or entertainment purposes.
Please consider reviewing these Tutorials on:
Elliott Wave Counting Tutorial #1
Elliott Wave Counting Tutorial #2
Elliott Wave Counting Tutorial #3
Laddering and Buy/Sell Setups.
Laddering Example with EOS
Tutorial on the use of Fibonacci & Elliott Waves
@haejin's Trading Nuggets
Essay: Is Technical Analysis a Quantum Event?
Follow me on Twitter for Real Time Alerts!!
Follow me on StockTwits for UpDates!!
--
--

