
SUMMARY
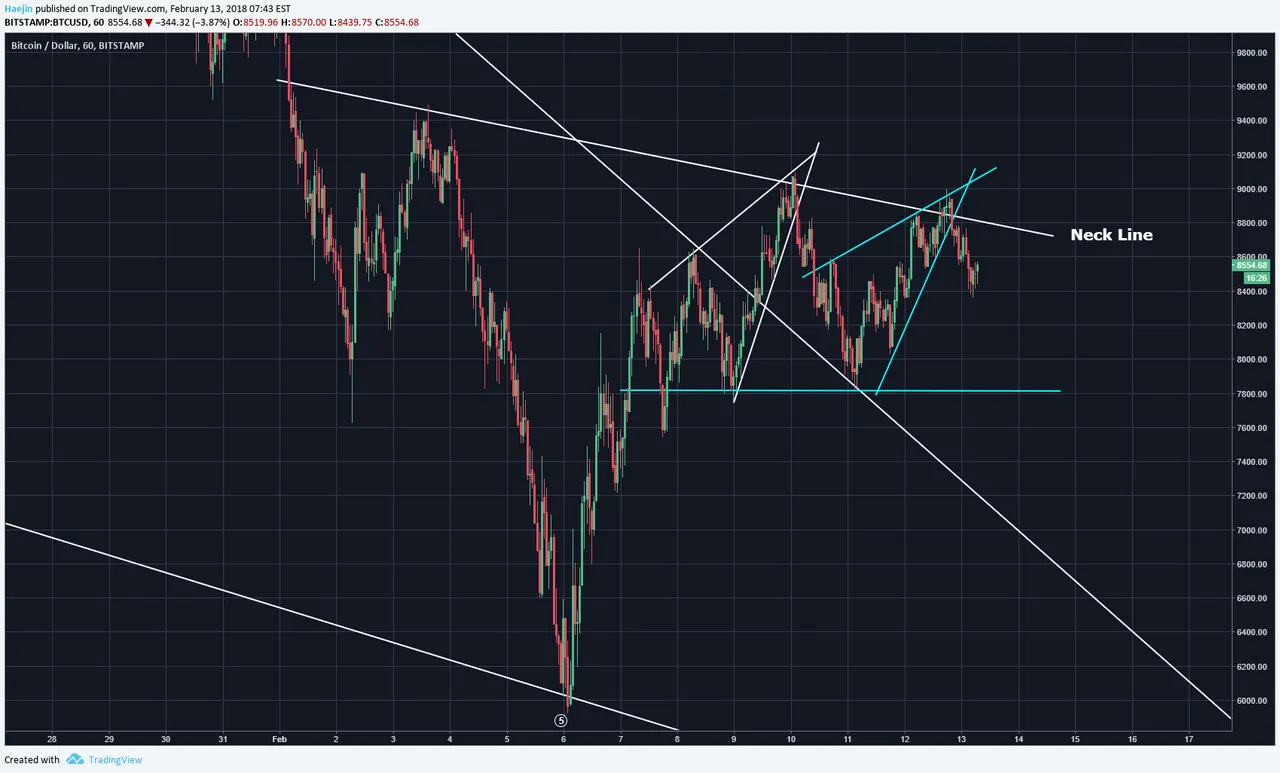
Bitcoin (BTC) overnight price action has decided to follow through with the wedge fractal. The white one shows the potential price pathway for the blue wedge.
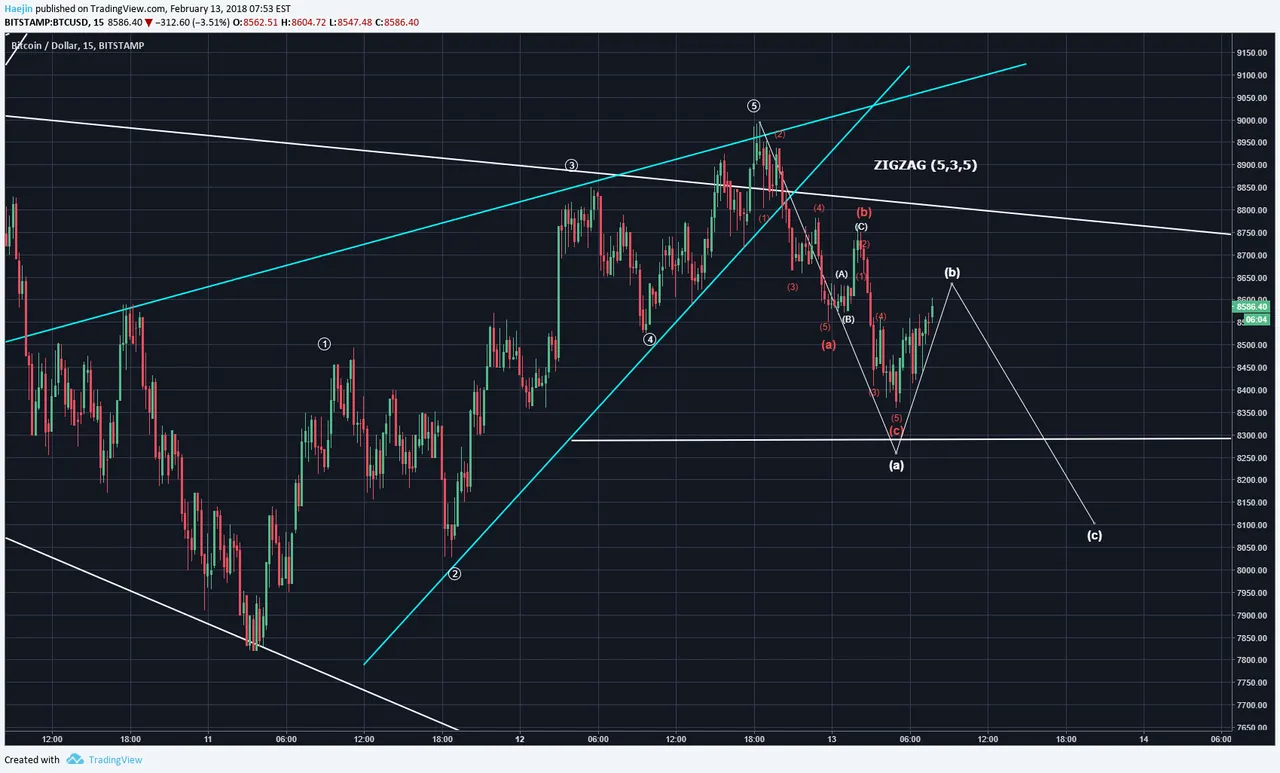
Zooming in to as high as 15 minute chart, the abc divides well into a ZigZag (5,3,5). The subwaves show that waves a,c both subdivide well into fives. It's important to be aware that the abc red could likely be subwaves to a higher degree white abc as shown in below chart. IF this is correct, then $8,200 or so could be reached; but not required.
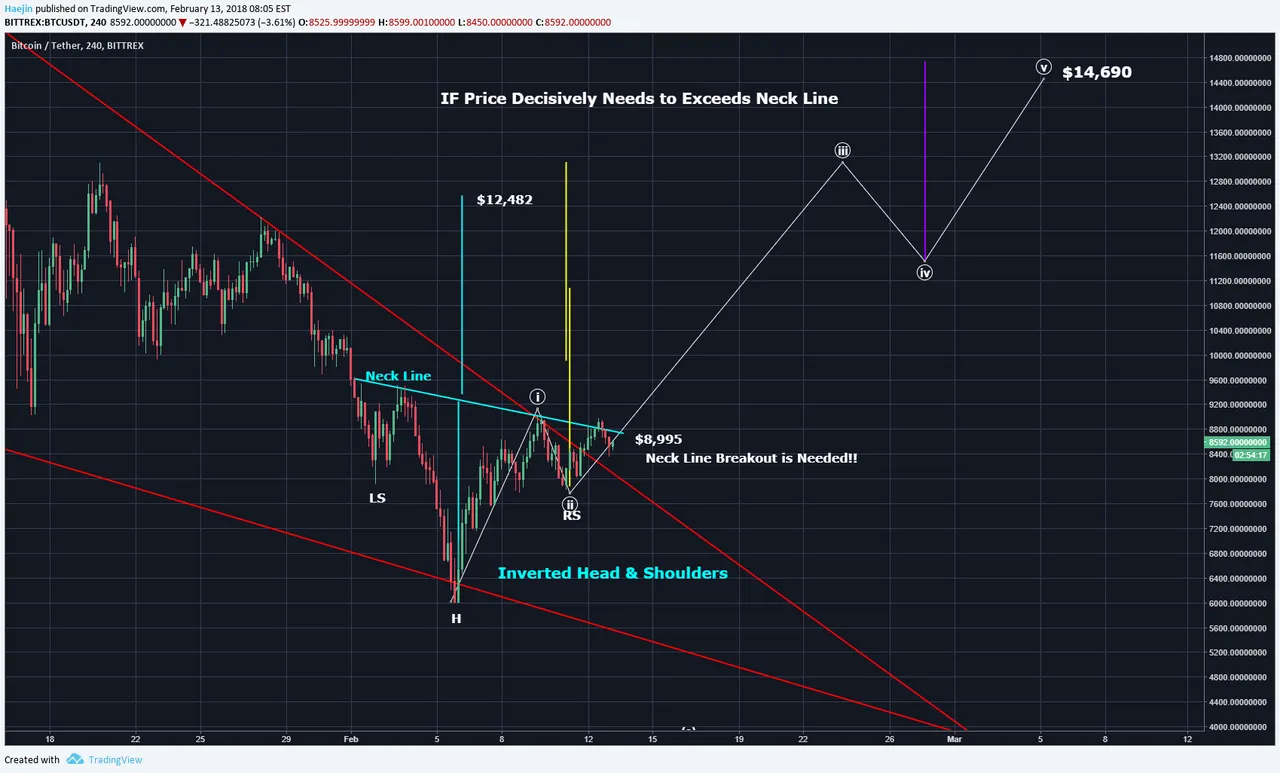
From a larger picture and patter perspective, the inverted Head & Shoulders pattern is still progress of trying to be confirmed. As price has not yet decisively breached the upper white line, the $8,995 remains to be taken down.
Legal Disclaimer: This is only my opinion, make of it what you wish. What does this mean? It means it's not advice nor recommendation to either buy or sell anything! It's only meant for use as informative or entertainment purposes.
Please consider reviewing these Tutorials on:
Elliott Wave Counting Tutorial #1
Elliott Wave Counting Tutorial #2
Elliott Wave Counting Tutorial #3
Laddering and Buy/Sell Setups.
Laddering Example with EOS
Tutorial on the use of Fibonacci & Elliott Waves
@haejin's Trading Nuggets
Essay: Is Technical Analysis a Quantum Event?
Follow me on Twitter for Real Time Alerts!!
Follow me on StockTwits for UpDates!!
--
--

