
SUMMARY
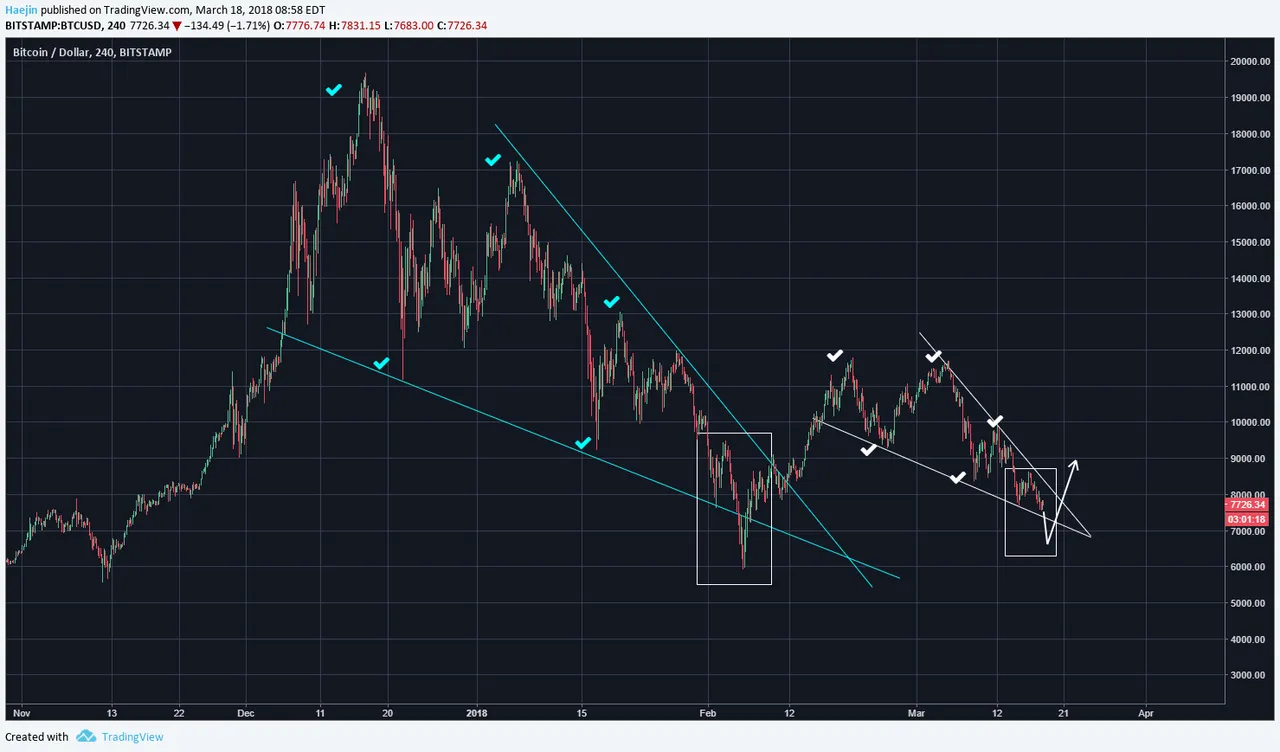
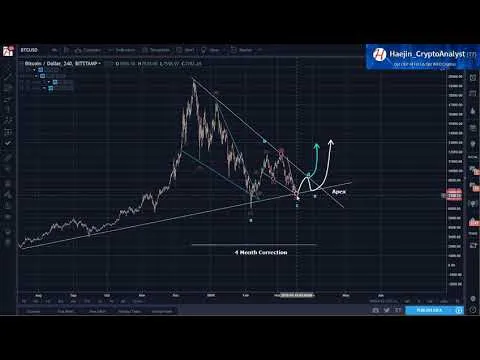
Bitcoin's (BTC) overnight price action generated a lower low. The below chart shows that the fractal points are still being ahdered to. The white square region is the point of focus for today. More details in the video!
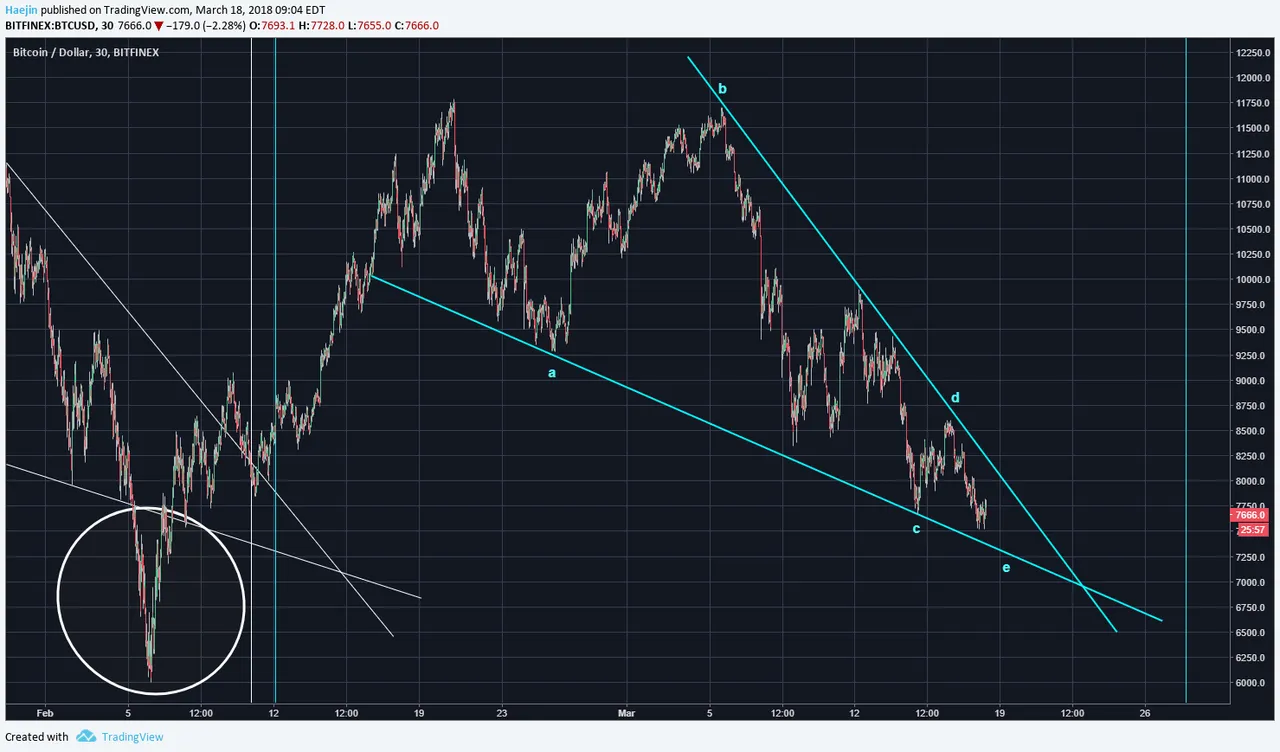
I've repositioned the blue C wave by lowering it down. It allows better forma nd fit and so the final e wave also becomes the shortest.
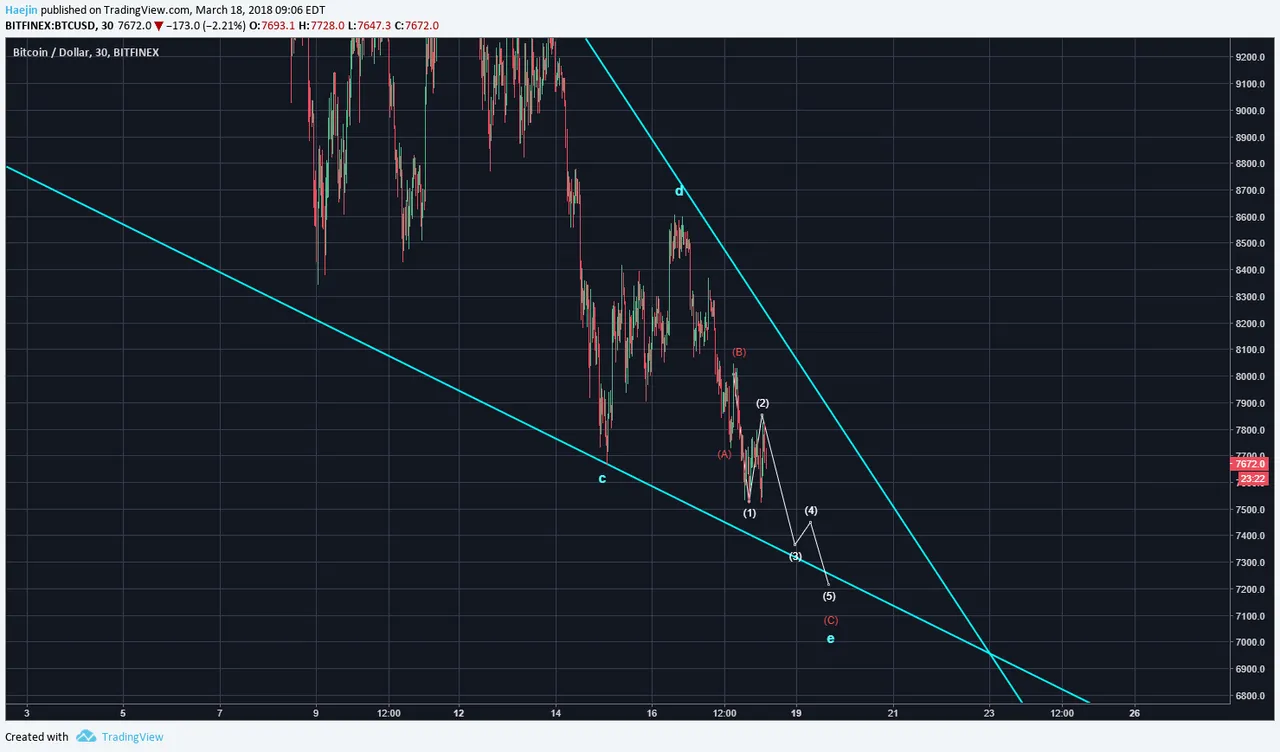
Subwave counting shows the final blue e wave to be in the process of completing and if this is correct, then waves 3,4,5 will allow the completiong for this wedge. This also means today could likely bring about a lower low in the $6,900 to $7,300 range. The correction is almost done, IMHO.
Part 1:
Part 2:
Legal Disclaimer: I am not a financial advisor nor is any content in this article presented as financial advice. The information provided in this blog post and any other posts that I make and any accompanying material is for informational purposes only. It should not be considered financial or investment advice of any kind. One should consult with a financial or investment professional to determine what may be best for your individual needs. Plain English: This is only my opinion, make of it what you wish. What does this mean? It means it's not advice nor recommendation to either buy or sell anything! It's only meant for use as informative or entertainment purposes.
Please consider reviewing these Tutorials on:
Elliott Wave Counting Tutorial #1
Elliott Wave Counting Tutorial #2
Elliott Wave Counting Tutorial #3
Laddering and Buy/Sell Setups.
Laddering Example with EOS
Tutorial on the use of Fibonacci & Elliott Waves
@haejin's Trading Nuggets
Essay: Is Technical Analysis a Quantum Event?
Follow me on Twitter for Real Time Alerts!!
Follow me on StockTwits for UpDates!!
--
--

