
SUMMARY
(slow Wifi...might take a few minutes for video to complete uploading)
Here is the link to Essay on TA being a Quantum Event
This video has very good details on why Technical Analysis is not able to project time. I recommend viewing it!
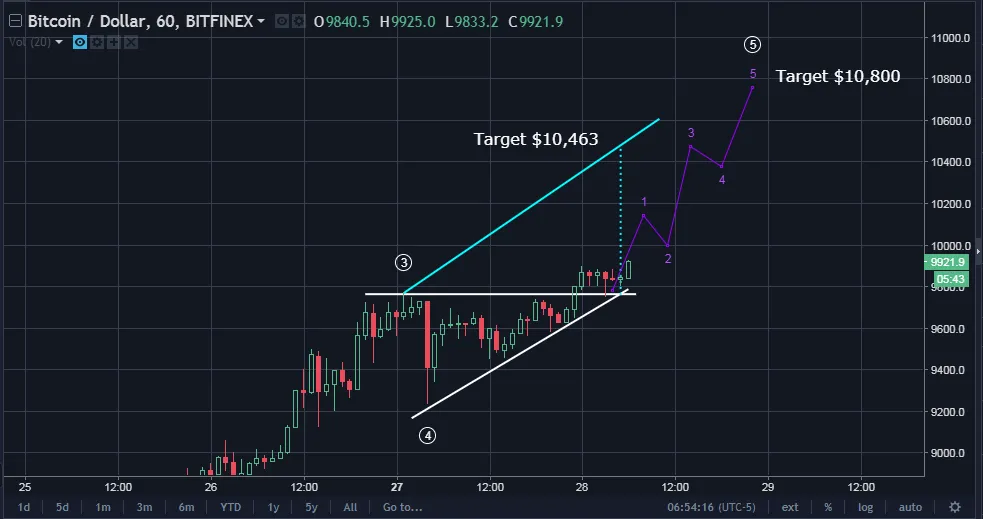
Below is a revised chart showing an scending right triangle and so I've moved the target to $10,800...perhaps even $11,000 shall be hit.
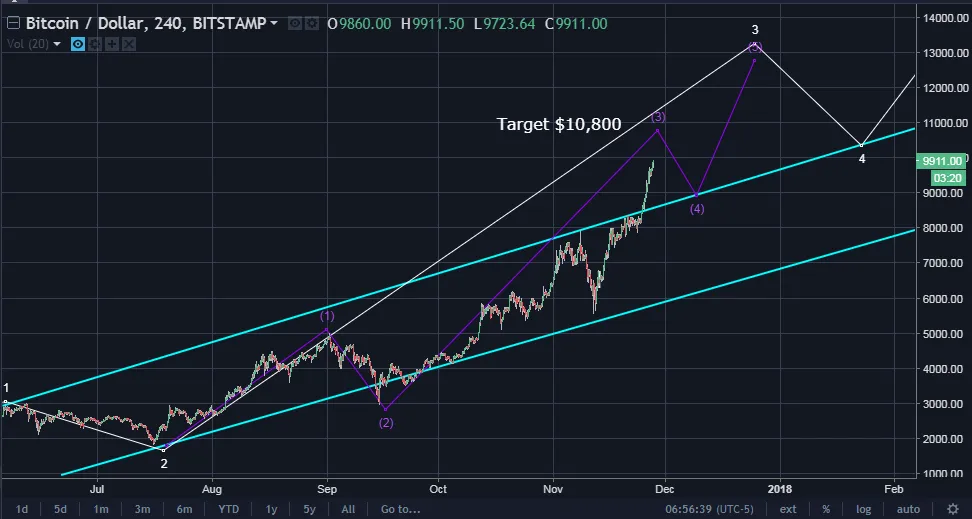
The longer term chart shows how the current rise fits into purple wave 3 which target I've also raised and adjusted. It looks classic and vintage rhyme of price and waves!
Please consider reviewing these Tutorials on:
Elliott Wave Counting Tutorial #1
Elliott Wave Counting Tutorial #2
Laddering and Buy/Sell Setups.
Tutorial on the use of Fibonacci & Elliott Waves
These Technical Analysis Books: Elliott Wave Priniciple & Technical Analysis of Stock Trends are highly recommended
Follow me on Twitter for Real Time Alerts!!
--
--

If this blog post has entertained or helped you to profit, please follow, upvote, resteem and/or consider buying me a beer:
BTS Wallet - haejin1970
BTC Wallet - 15ugC4U4k3qsxEXT5YF7ukz3pjtnw2im8B
ETH Wallet - 0x1Ab87962dD59BBfFe33819772C950F0B38554030
LTC Wallet - LecCNCzkt4vjVq2i3bgYiebmr9GbYo6FQf

Legal Mumbo Jumbo: This is only my opinion, make of it what you wish. What does this mean? It means it's not advice nor recommendation to either buy or sell anything! It's only meant for use as informative or entertainment purposes.**