
SUMMARY
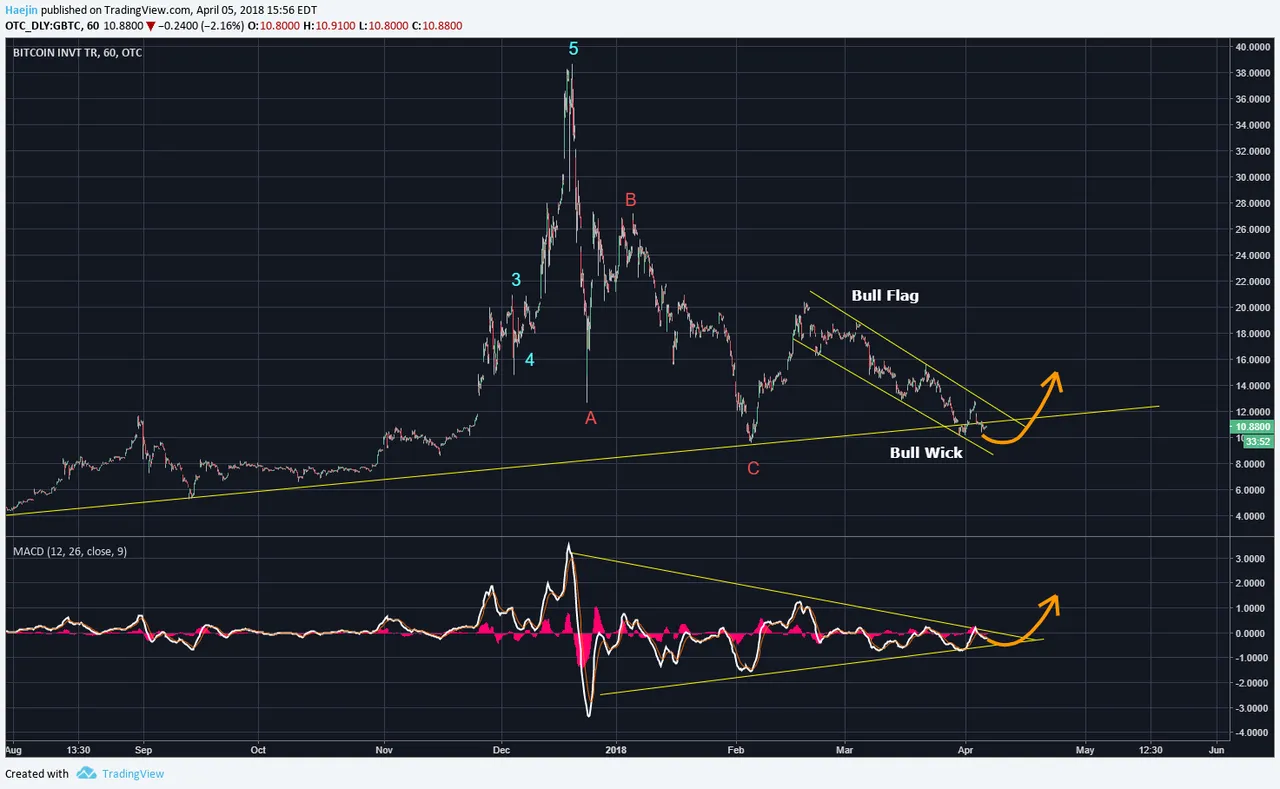
Bitcoin Investment Trust (GBTC) has pierced the long term support line for the second time and likely setting up a bull flag event. What this means is that price needs to resurface back above the support line and often this could take a few days. A decisive breach would lead to newer lows.

The MACD in this 4 hour chart is bound within the contracting symmetrical triangle lines. The brown arrow line would likely call for a small dip towards the lower suport line and yes, price is expected to follow which would also satisfy the bull wick making. The price is also moveing within a bull flag, downward pointing, channel. The confluence of pattern and waves and Indicator is quite noticeable.
Legal Disclaimer: I am not a financial advisor nor is any content in this article presented as financial advice. The information provided in this blog post and any other posts that I make and any accompanying material is for informational purposes only. It should not be considered financial or investment advice of any kind. One should consult with a financial or investment professional to determine what may be best for your individual needs. Plain English: This is only my opinion, make of it what you wish. What does this mean? It means it's not advice nor recommendation to either buy or sell anything! It's only meant for use as informative or entertainment purposes.
Please consider reviewing these Tutorials on:
Elliott Wave Counting Tutorial #1
Elliott Wave Counting Tutorial #2
Elliott Wave Counting Tutorial #3
Laddering and Buy/Sell Setups.
Laddering Example with EOS
Tutorial on the use of Fibonacci & Elliott Waves
@haejin's Trading Nuggets
Essay: Is Technical Analysis a Quantum Event?
Follow me on Twitter for Real Time Alerts!!
Follow me on StockTwits for UpDates!!
--
--

