
SUMMARY
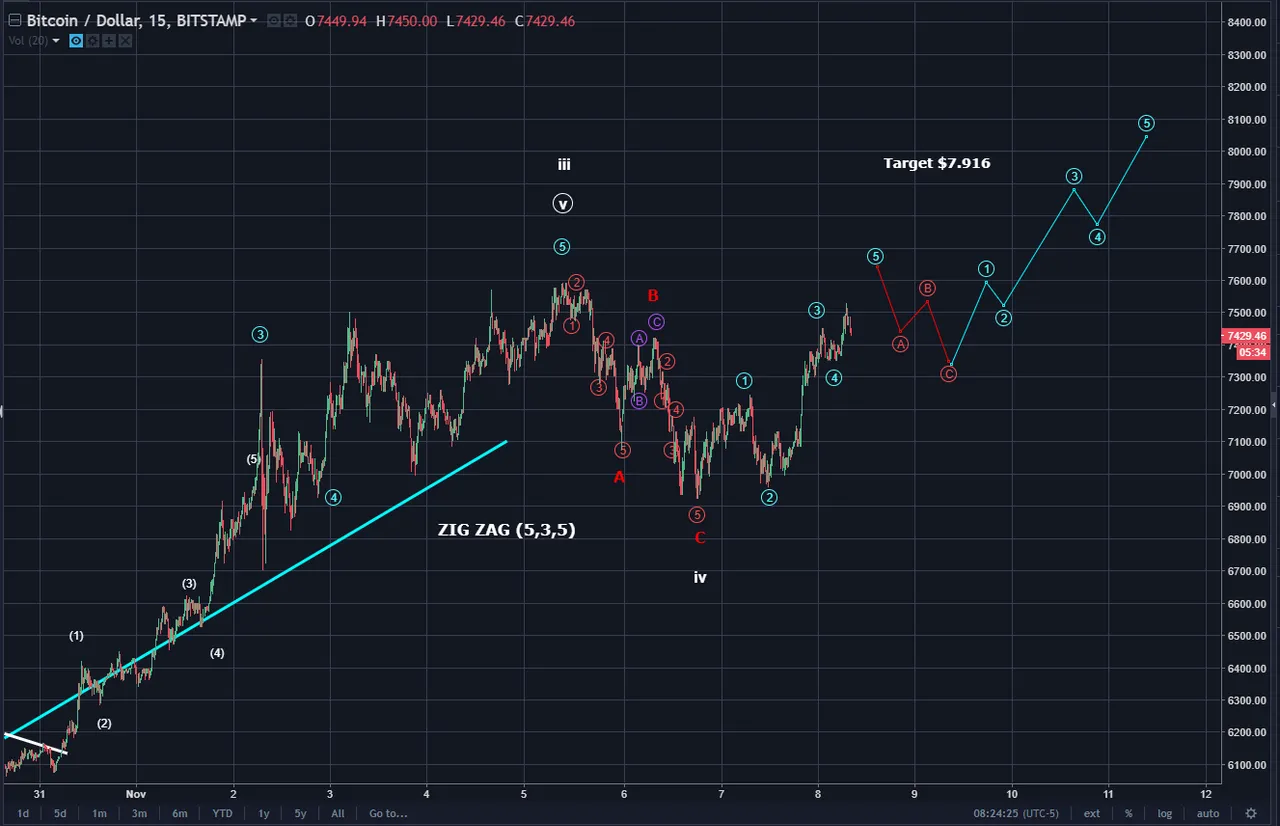
Bitcoin (BTC) overnight price action climbed moderately higher. The below chart shows the projected price pathway should the A,B,C red waves are complete. The circled blue waves could be drawn as impulsive set of fives and thus trek towards the $7,916 target destination.
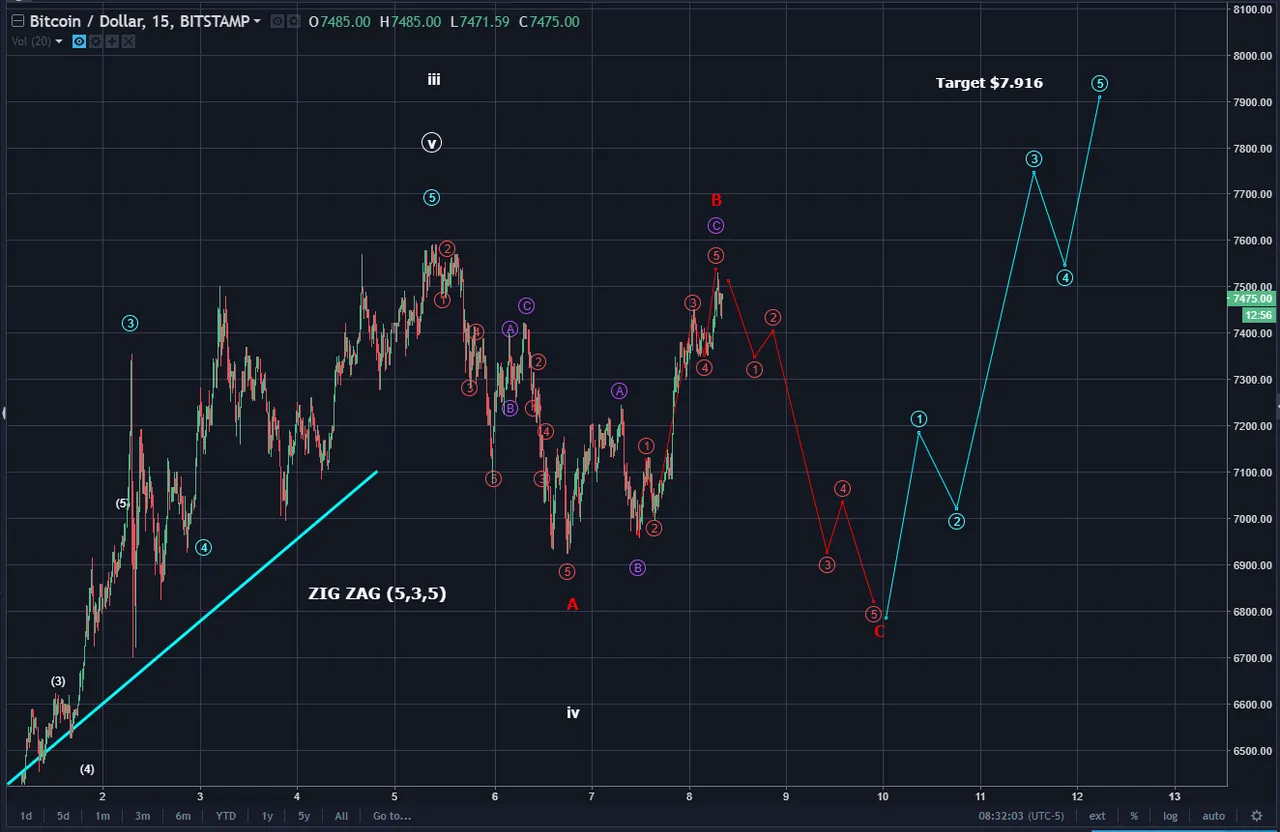
The chart below remains my primary count. It shows that the current rise in price is that of the red B wave of the A,B,C correction. This B wave is subdivided into circled purple a,b,c and the c wave is further subdivided into fives since every c wave of a flat of zig zag has five waves. If this is correct, expect prices to start putting lower lows towards the large red C wave at around $6,800 or so. Still, it makes no matter which price pathway this correction takes since the destination remains the same for both and that is UP! The video has detailed wave counts and thus a very good review to the Elliott Wave Count Tutorial.
Please consider reviewing these Tutorials on:
Elliott Wave Counting Tutorial
Laddering and Buy/Sell Setups.
Tutorial on the use of Fibonacci & Elliott Waves
These Technical Analysis Books: [Elliott Wave Priniciple & Technical Analysis of Stock Trends !](https://steemit.com/bitcoin/@haejin/n98sk-haejin-s-ta-book-recommendations-for-elliott-wave-and-chart-pattern-recognition are highly recommended
--
--

If this blog post has entertained or helped you to profit, please follow, upvote, resteem and/or consider buying me a beer:
BTS Wallet - d2e60e9856c36f34
BTC Wallet - 15ugC4U4k3qsxEXT5YF7ukz3pjtnw2im8B
ETH Wallet - 0x1Ab87962dD59BBfFe33819772C950F0B38554030
LTC Wallet - LefeWrQXumis3MzrsvxHWzpNBAAFDQbB66

Legal Mumbo Jumbo: This is only my opinion, make of it what you wish. What does this mean? It means it's not advice nor recommendation to either buy or sell anything! It's only meant for use as informative or entertainment purposes.**