
SUMMARY
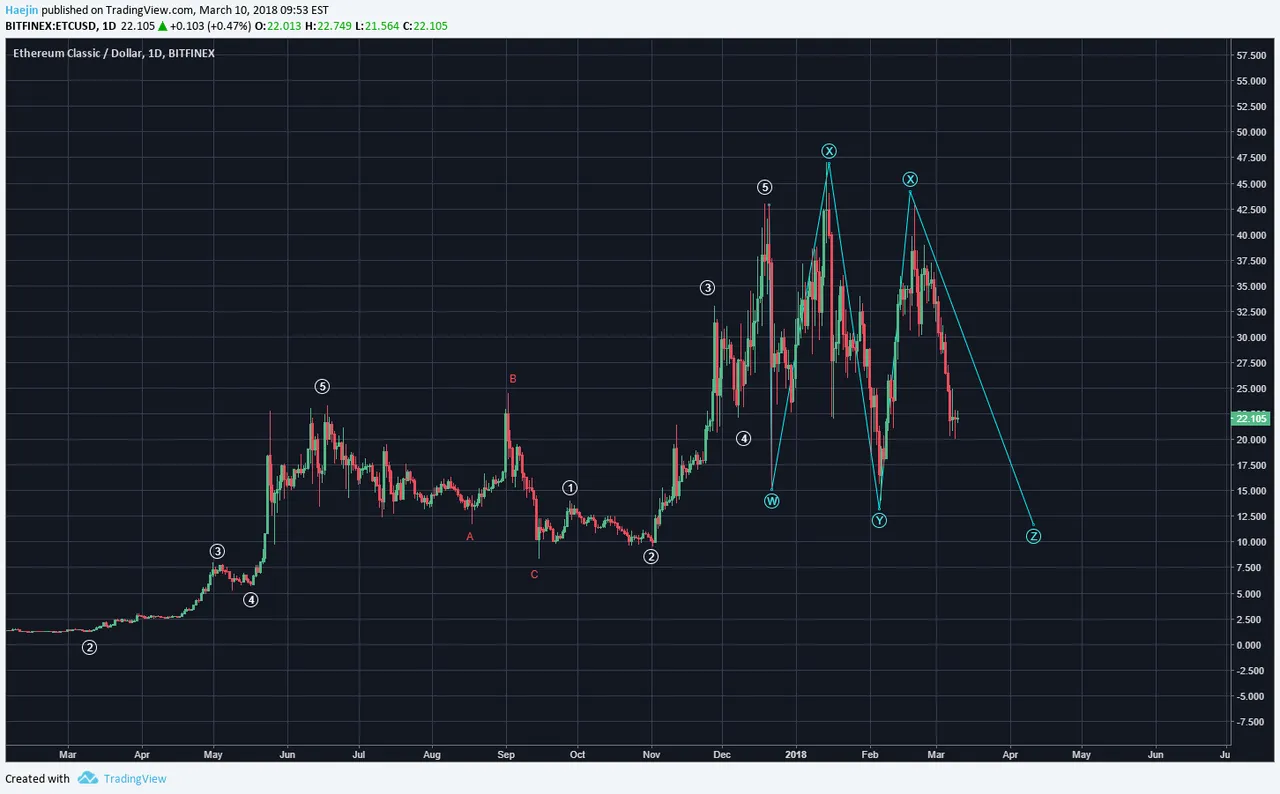
Back on February 28th, the below chart was posted for Ethereum Classic (ETC). Since price had been moving sideways in an alligator tooth type of volatility; the undertone of an incomplete correction was clearly noticeable. The blue WXYXZ label was used to indicate also that the correction needed more time consumption.

As of this morning, ETC has turned down after completing the second blue x wave. This current decline is likely the blue Z wave and once complete, it could provide a good potential corrective bottom level.
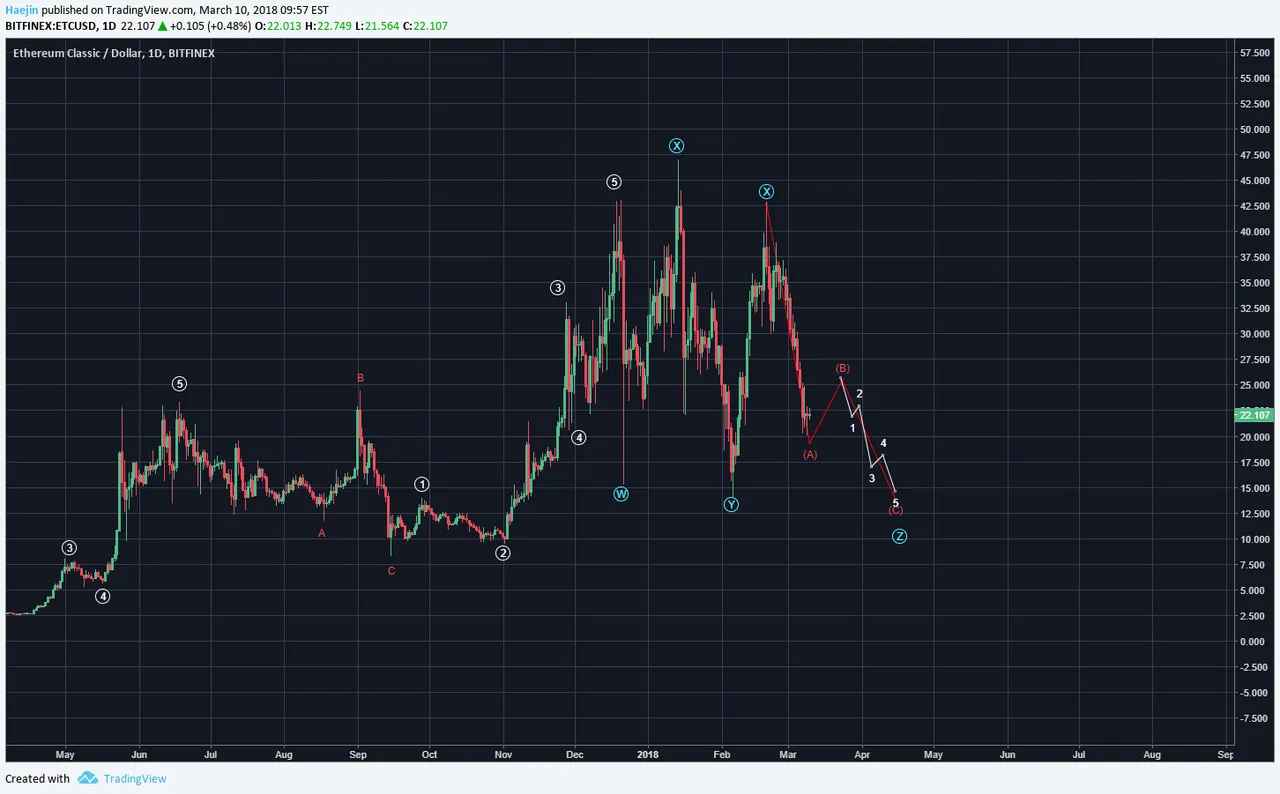
Here is the closeup showing the breakdown of the final blue Z wave into its subwaves, red ABC. I believe this will probably be a zigzag in wave count and if so, the final wave C needs to subdivide into fives as shown.
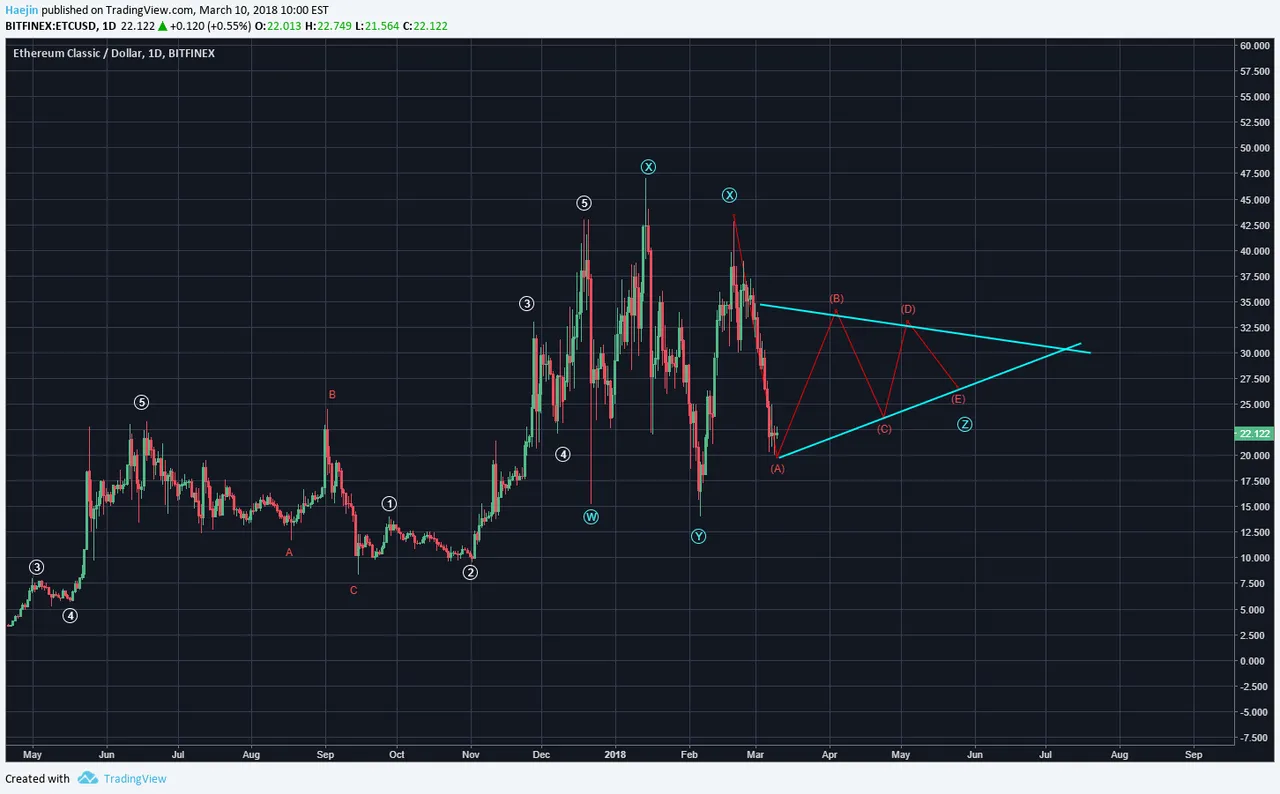
There is an alternate where WXYXZ corrections can form the final Z wave as a triangle. This is much more common in Cryptos than in equities and so awareness of this alternate could be helpful.
Legal Disclaimer: I am not a financial advisor nor is any content in this article presented as financial advice. The information provided in this blog post and any other posts that I make and any accompanying material is for informational purposes only. It should not be considered financial or investment advice of any kind. One should consult with a financial or investment professional to determine what may be best for your individual needs. Plain English: This is only my opinion, make of it what you wish. What does this mean? It means it's not advice nor recommendation to either buy or sell anything! It's only meant for use as informative or entertainment purposes.
Please consider reviewing these Tutorials on:
Elliott Wave Counting Tutorial #1
Elliott Wave Counting Tutorial #2
Elliott Wave Counting Tutorial #3
Laddering and Buy/Sell Setups.
Laddering Example with EOS
Tutorial on the use of Fibonacci & Elliott Waves
@haejin's Trading Nuggets
Essay: Is Technical Analysis a Quantum Event?
Follow me on Twitter for Real Time Alerts!!
Follow me on StockTwits for UpDates!!
--
--

